Immigrants from Brazil vs Immigrants from Ecuador Householder Income Ages 25 - 44 years
COMPARE
Immigrants from Brazil
Immigrants from Ecuador
Householder Income Ages 25 - 44 years
Householder Income Ages 25 - 44 years Comparison
Immigrants from Brazil
Immigrants from Ecuador
$100,534
HOUSEHOLDER INCOME AGES 25 - 44 YEARS
96.5/ 100
METRIC RATING
106th/ 347
METRIC RANK
$89,673
HOUSEHOLDER INCOME AGES 25 - 44 YEARS
6.2/ 100
METRIC RATING
222nd/ 347
METRIC RANK
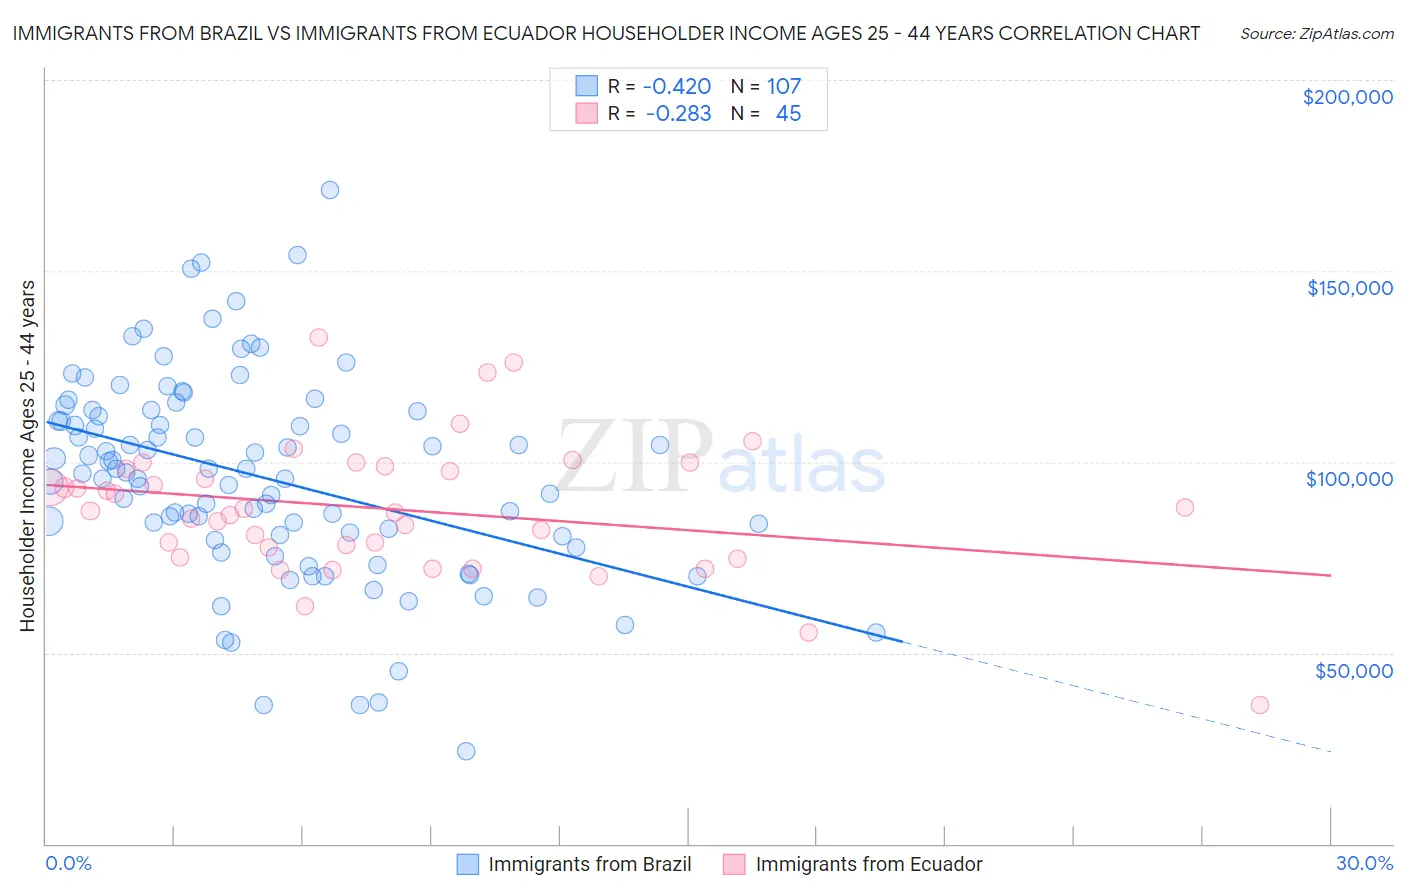
Immigrants from Brazil vs Immigrants from Ecuador Householder Income Ages 25 - 44 years Correlation Chart
The statistical analysis conducted on geographies consisting of 342,484,702 people shows a moderate negative correlation between the proportion of Immigrants from Brazil and household income with householder between the ages 25 and 44 in the United States with a correlation coefficient (R) of -0.420 and weighted average of $100,534. Similarly, the statistical analysis conducted on geographies consisting of 270,658,714 people shows a weak negative correlation between the proportion of Immigrants from Ecuador and household income with householder between the ages 25 and 44 in the United States with a correlation coefficient (R) of -0.283 and weighted average of $89,673, a difference of 12.1%.
Householder Income Ages 25 - 44 years Correlation Summary
| Measurement | Immigrants from Brazil | Immigrants from Ecuador |
| Minimum | $24,240 | $36,176 |
| Maximum | $171,042 | $132,426 |
| Range | $146,802 | $96,250 |
| Mean | $95,965 | $87,697 |
| Median | $97,321 | $87,101 |
| Interquartile 25% (IQ1) | $80,473 | $76,225 |
| Interquartile 75% (IQ3) | $113,214 | $98,630 |
| Interquartile Range (IQR) | $32,741 | $22,405 |
| Standard Deviation (Sample) | $26,677 | $17,650 |
| Standard Deviation (Population) | $26,552 | $17,453 |
Similar Demographics by Householder Income Ages 25 - 44 years
Demographics Similar to Immigrants from Brazil by Householder Income Ages 25 - 44 years
In terms of householder income ages 25 - 44 years, the demographic groups most similar to Immigrants from Brazil are Immigrants from Vietnam ($100,535, a difference of 0.0%), Northern European ($100,457, a difference of 0.080%), Immigrants from South Eastern Asia ($100,283, a difference of 0.25%), Immigrants from North Macedonia ($100,101, a difference of 0.43%), and Immigrants from Poland ($101,065, a difference of 0.53%).
| Demographics | Rating | Rank | Householder Income Ages 25 - 44 years |
| Taiwanese | 97.9 /100 | #99 | Exceptional $101,492 |
| Immigrants | Argentina | 97.8 /100 | #100 | Exceptional $101,415 |
| Albanians | 97.8 /100 | #101 | Exceptional $101,367 |
| Immigrants | Lebanon | 97.4 /100 | #102 | Exceptional $101,124 |
| Immigrants | Moldova | 97.4 /100 | #103 | Exceptional $101,091 |
| Immigrants | Poland | 97.4 /100 | #104 | Exceptional $101,065 |
| Immigrants | Vietnam | 96.5 /100 | #105 | Exceptional $100,535 |
| Immigrants | Brazil | 96.5 /100 | #106 | Exceptional $100,534 |
| Northern Europeans | 96.3 /100 | #107 | Exceptional $100,457 |
| Immigrants | South Eastern Asia | 96.0 /100 | #108 | Exceptional $100,283 |
| Immigrants | North Macedonia | 95.6 /100 | #109 | Exceptional $100,101 |
| Immigrants | Afghanistan | 95.3 /100 | #110 | Exceptional $99,977 |
| Chileans | 95.1 /100 | #111 | Exceptional $99,900 |
| Poles | 94.5 /100 | #112 | Exceptional $99,685 |
| Tongans | 94.2 /100 | #113 | Exceptional $99,604 |
Demographics Similar to Immigrants from Ecuador by Householder Income Ages 25 - 44 years
In terms of householder income ages 25 - 44 years, the demographic groups most similar to Immigrants from Ecuador are Immigrants from Trinidad and Tobago ($89,748, a difference of 0.080%), Immigrants from Guyana ($89,586, a difference of 0.10%), Barbadian ($89,565, a difference of 0.12%), Trinidadian and Tobagonian ($89,856, a difference of 0.20%), and Delaware ($89,876, a difference of 0.23%).
| Demographics | Rating | Rank | Householder Income Ages 25 - 44 years |
| Panamanians | 8.1 /100 | #215 | Tragic $90,193 |
| Ghanaians | 7.9 /100 | #216 | Tragic $90,137 |
| Scotch-Irish | 7.3 /100 | #217 | Tragic $89,969 |
| Guyanese | 7.1 /100 | #218 | Tragic $89,940 |
| Delaware | 6.9 /100 | #219 | Tragic $89,876 |
| Trinidadians and Tobagonians | 6.8 /100 | #220 | Tragic $89,856 |
| Immigrants | Trinidad and Tobago | 6.5 /100 | #221 | Tragic $89,748 |
| Immigrants | Ecuador | 6.2 /100 | #222 | Tragic $89,673 |
| Immigrants | Guyana | 5.9 /100 | #223 | Tragic $89,586 |
| Barbadians | 5.9 /100 | #224 | Tragic $89,565 |
| Immigrants | Panama | 5.5 /100 | #225 | Tragic $89,451 |
| Immigrants | Iraq | 5.5 /100 | #226 | Tragic $89,444 |
| Immigrants | St. Vincent and the Grenadines | 4.1 /100 | #227 | Tragic $88,888 |
| Immigrants | Bosnia and Herzegovina | 4.0 /100 | #228 | Tragic $88,819 |
| Immigrants | Barbados | 3.7 /100 | #229 | Tragic $88,687 |