Immigrants from Brazil vs Thai Unemployment Among Women with Children Ages 6 to 17 years
COMPARE
Immigrants from Brazil
Thai
Unemployment Among Women with Children Ages 6 to 17 years
Unemployment Among Women with Children Ages 6 to 17 years Comparison
Immigrants from Brazil
Thais
9.0%
UNEMPLOYMENT AMONG WOMEN WITH CHILDREN AGES 6 TO 17 YEARS
51.0/ 100
METRIC RATING
173rd/ 347
METRIC RANK
7.8%
UNEMPLOYMENT AMONG WOMEN WITH CHILDREN AGES 6 TO 17 YEARS
100.0/ 100
METRIC RATING
29th/ 347
METRIC RANK
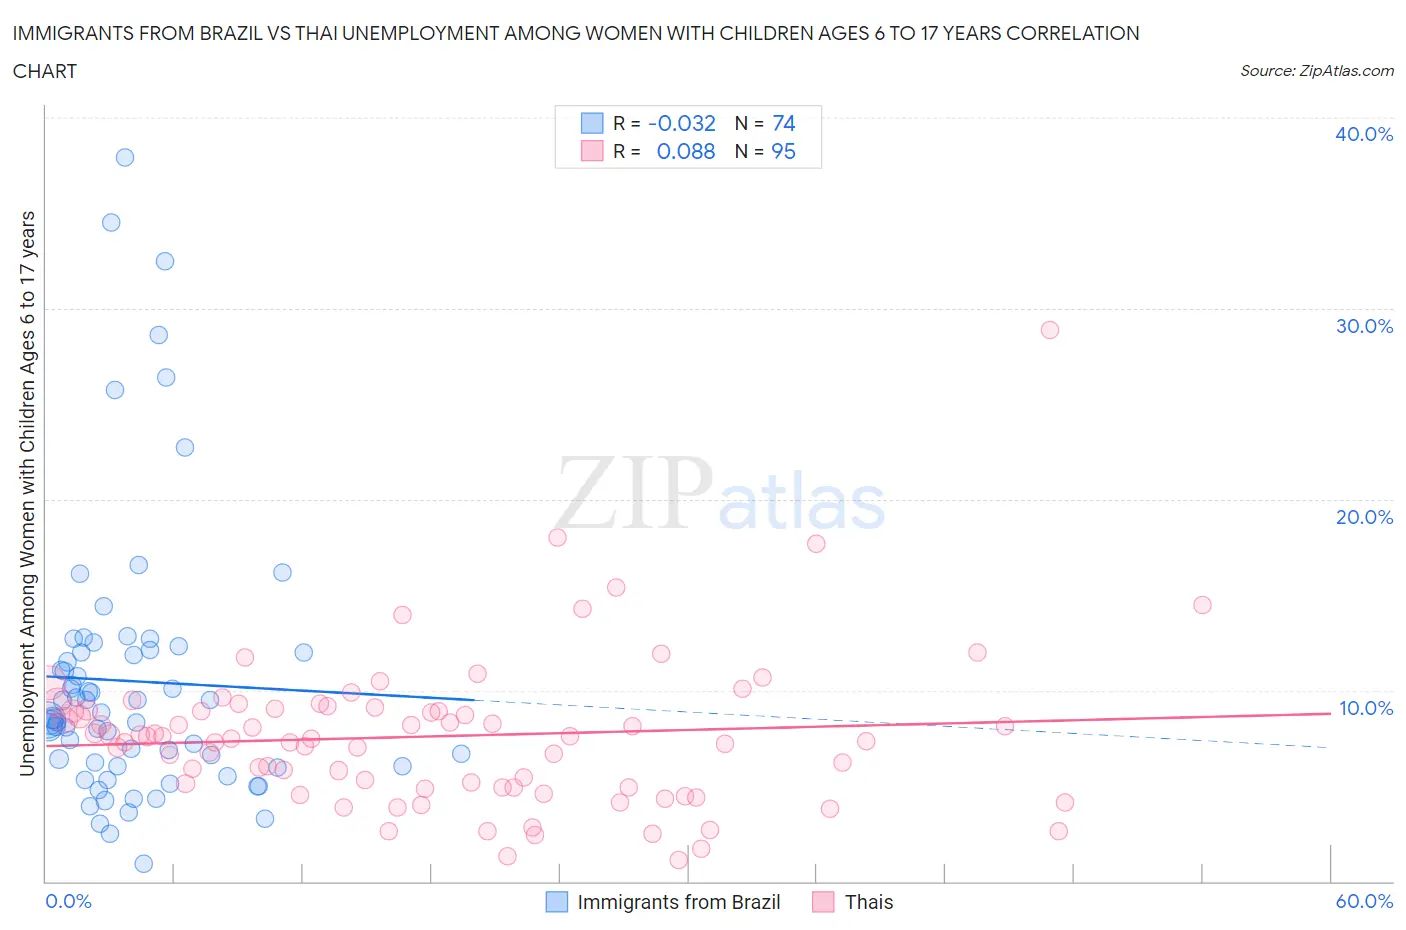
Immigrants from Brazil vs Thai Unemployment Among Women with Children Ages 6 to 17 years Correlation Chart
The statistical analysis conducted on geographies consisting of 251,390,083 people shows no correlation between the proportion of Immigrants from Brazil and unemployment rate among women with children between the ages 6 and 17 in the United States with a correlation coefficient (R) of -0.032 and weighted average of 9.0%. Similarly, the statistical analysis conducted on geographies consisting of 328,573,695 people shows a slight positive correlation between the proportion of Thais and unemployment rate among women with children between the ages 6 and 17 in the United States with a correlation coefficient (R) of 0.088 and weighted average of 7.8%, a difference of 14.5%.
Unemployment Among Women with Children Ages 6 to 17 years Correlation Summary
| Measurement | Immigrants from Brazil | Thai |
| Minimum | 0.90% | 1.1% |
| Maximum | 37.9% | 28.9% |
| Range | 37.0% | 27.8% |
| Mean | 10.5% | 7.6% |
| Median | 8.5% | 7.5% |
| Interquartile 25% (IQ1) | 6.1% | 4.9% |
| Interquartile 75% (IQ3) | 12.0% | 9.0% |
| Interquartile Range (IQR) | 5.9% | 4.1% |
| Standard Deviation (Sample) | 7.2% | 4.0% |
| Standard Deviation (Population) | 7.2% | 4.0% |
Similar Demographics by Unemployment Among Women with Children Ages 6 to 17 years
Demographics Similar to Immigrants from Brazil by Unemployment Among Women with Children Ages 6 to 17 years
In terms of unemployment among women with children ages 6 to 17 years, the demographic groups most similar to Immigrants from Brazil are Jordanian (9.0%, a difference of 0.050%), Immigrants from West Indies (9.0%, a difference of 0.050%), Immigrants from Costa Rica (9.0%, a difference of 0.050%), Turkish (8.9%, a difference of 0.14%), and British (8.9%, a difference of 0.19%).
| Demographics | Rating | Rank | Unemployment Among Women with Children Ages 6 to 17 years |
| Moroccans | 58.3 /100 | #166 | Average 8.9% |
| Immigrants | England | 57.7 /100 | #167 | Average 8.9% |
| Immigrants | Croatia | 57.1 /100 | #168 | Average 8.9% |
| British | 55.2 /100 | #169 | Average 8.9% |
| Turks | 54.1 /100 | #170 | Average 8.9% |
| Jordanians | 52.2 /100 | #171 | Average 9.0% |
| Immigrants | West Indies | 52.2 /100 | #172 | Average 9.0% |
| Immigrants | Brazil | 51.0 /100 | #173 | Average 9.0% |
| Immigrants | Costa Rica | 50.0 /100 | #174 | Average 9.0% |
| Immigrants | Sierra Leone | 45.9 /100 | #175 | Average 9.0% |
| Immigrants | Italy | 43.7 /100 | #176 | Average 9.0% |
| Immigrants | Jordan | 41.6 /100 | #177 | Average 9.0% |
| Menominee | 39.3 /100 | #178 | Fair 9.0% |
| Immigrants | Zaire | 38.3 /100 | #179 | Fair 9.0% |
| Ethiopians | 37.6 /100 | #180 | Fair 9.0% |
Demographics Similar to Thais by Unemployment Among Women with Children Ages 6 to 17 years
In terms of unemployment among women with children ages 6 to 17 years, the demographic groups most similar to Thais are Immigrants from Uzbekistan (7.8%, a difference of 0.34%), Immigrants from Afghanistan (7.8%, a difference of 0.67%), Immigrants from Iran (7.9%, a difference of 0.89%), Laotian (7.9%, a difference of 1.1%), and Immigrants from Cambodia (7.9%, a difference of 1.1%).
| Demographics | Rating | Rank | Unemployment Among Women with Children Ages 6 to 17 years |
| Immigrants | China | 100.0 /100 | #22 | Exceptional 7.7% |
| Immigrants | Indonesia | 100.0 /100 | #23 | Exceptional 7.7% |
| Nepalese | 100.0 /100 | #24 | Exceptional 7.7% |
| Immigrants | Eastern Asia | 100.0 /100 | #25 | Exceptional 7.7% |
| Indians (Asian) | 100.0 /100 | #26 | Exceptional 7.7% |
| Immigrants | Afghanistan | 100.0 /100 | #27 | Exceptional 7.8% |
| Immigrants | Uzbekistan | 100.0 /100 | #28 | Exceptional 7.8% |
| Thais | 100.0 /100 | #29 | Exceptional 7.8% |
| Immigrants | Iran | 100.0 /100 | #30 | Exceptional 7.9% |
| Laotians | 100.0 /100 | #31 | Exceptional 7.9% |
| Immigrants | Cambodia | 100.0 /100 | #32 | Exceptional 7.9% |
| Immigrants | Korea | 100.0 /100 | #33 | Exceptional 7.9% |
| Native Hawaiians | 100.0 /100 | #34 | Exceptional 7.9% |
| Immigrants | South Central Asia | 100.0 /100 | #35 | Exceptional 7.9% |
| Burmese | 100.0 /100 | #36 | Exceptional 8.0% |