Immigrants from Syria vs Immigrants from Bosnia and Herzegovina Unemployment
COMPARE
Immigrants from Syria
Immigrants from Bosnia and Herzegovina
Unemployment
Unemployment Comparison
Immigrants from Syria
Immigrants from Bosnia and Herzegovina
5.5%
UNEMPLOYMENT
4.8/ 100
METRIC RATING
233rd/ 347
METRIC RANK
4.8%
UNEMPLOYMENT
99.7/ 100
METRIC RATING
41st/ 347
METRIC RANK
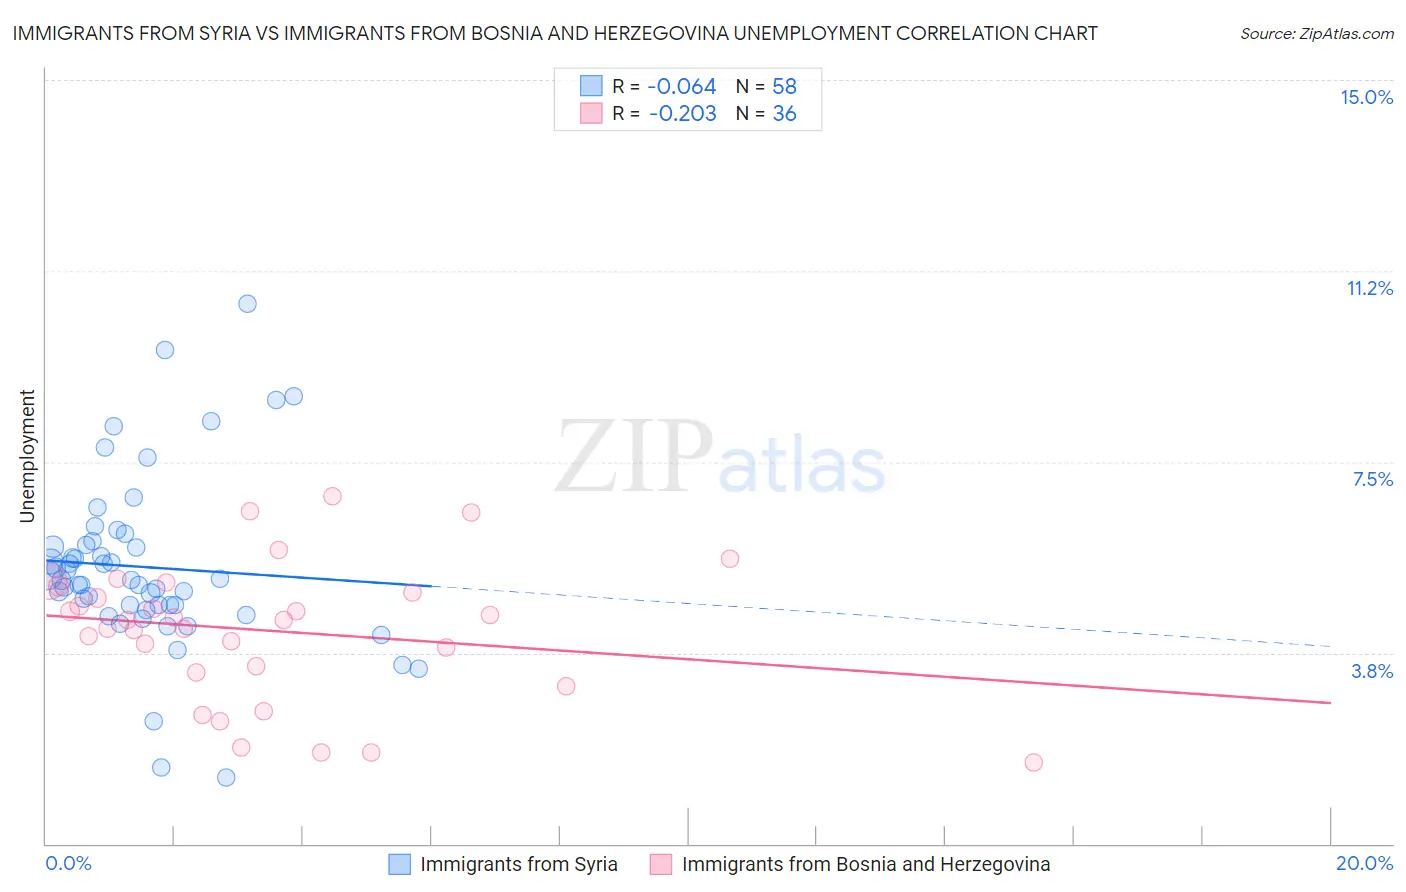
Immigrants from Syria vs Immigrants from Bosnia and Herzegovina Unemployment Correlation Chart
The statistical analysis conducted on geographies consisting of 173,974,388 people shows a slight negative correlation between the proportion of Immigrants from Syria and unemployment in the United States with a correlation coefficient (R) of -0.064 and weighted average of 5.5%. Similarly, the statistical analysis conducted on geographies consisting of 156,781,298 people shows a weak negative correlation between the proportion of Immigrants from Bosnia and Herzegovina and unemployment in the United States with a correlation coefficient (R) of -0.203 and weighted average of 4.8%, a difference of 14.6%.
Unemployment Correlation Summary
| Measurement | Immigrants from Syria | Immigrants from Bosnia and Herzegovina |
| Minimum | 1.3% | 1.6% |
| Maximum | 10.6% | 6.8% |
| Range | 9.3% | 5.2% |
| Mean | 5.4% | 4.2% |
| Median | 5.2% | 4.4% |
| Interquartile 25% (IQ1) | 4.7% | 3.4% |
| Interquartile 75% (IQ3) | 5.9% | 5.0% |
| Interquartile Range (IQR) | 1.2% | 1.6% |
| Standard Deviation (Sample) | 1.7% | 1.3% |
| Standard Deviation (Population) | 1.7% | 1.3% |
Similar Demographics by Unemployment
Demographics Similar to Immigrants from Syria by Unemployment
In terms of unemployment, the demographic groups most similar to Immigrants from Syria are Panamanian (5.5%, a difference of 0.030%), Immigrants from Africa (5.5%, a difference of 0.050%), Comanche (5.5%, a difference of 0.050%), Hawaiian (5.5%, a difference of 0.18%), and Ottawa (5.5%, a difference of 0.18%).
| Demographics | Rating | Rank | Unemployment |
| Samoans | 7.1 /100 | #226 | Tragic 5.5% |
| Immigrants | Lebanon | 7.0 /100 | #227 | Tragic 5.5% |
| Guamanians/Chamorros | 6.3 /100 | #228 | Tragic 5.5% |
| Hawaiians | 5.4 /100 | #229 | Tragic 5.5% |
| Ottawa | 5.4 /100 | #230 | Tragic 5.5% |
| Immigrants | Africa | 4.9 /100 | #231 | Tragic 5.5% |
| Comanche | 4.9 /100 | #232 | Tragic 5.5% |
| Immigrants | Syria | 4.8 /100 | #233 | Tragic 5.5% |
| Panamanians | 4.7 /100 | #234 | Tragic 5.5% |
| Immigrants | Panama | 3.4 /100 | #235 | Tragic 5.5% |
| Immigrants | Cambodia | 3.3 /100 | #236 | Tragic 5.5% |
| Moroccans | 3.2 /100 | #237 | Tragic 5.5% |
| Immigrants | Western Asia | 2.8 /100 | #238 | Tragic 5.5% |
| Immigrants | Immigrants | 2.6 /100 | #239 | Tragic 5.5% |
| Cree | 2.6 /100 | #240 | Tragic 5.6% |
Demographics Similar to Immigrants from Bosnia and Herzegovina by Unemployment
In terms of unemployment, the demographic groups most similar to Immigrants from Bosnia and Herzegovina are Northern European (4.8%, a difference of 0.030%), Lithuanian (4.8%, a difference of 0.040%), Bolivian (4.8%, a difference of 0.19%), Czechoslovakian (4.8%, a difference of 0.38%), and Tongan (4.8%, a difference of 0.45%).
| Demographics | Rating | Rank | Unemployment |
| Immigrants | Bolivia | 99.8 /100 | #34 | Exceptional 4.8% |
| Scotch-Irish | 99.8 /100 | #35 | Exceptional 4.8% |
| Tongans | 99.7 /100 | #36 | Exceptional 4.8% |
| Czechoslovakians | 99.7 /100 | #37 | Exceptional 4.8% |
| Bolivians | 99.7 /100 | #38 | Exceptional 4.8% |
| Lithuanians | 99.7 /100 | #39 | Exceptional 4.8% |
| Northern Europeans | 99.7 /100 | #40 | Exceptional 4.8% |
| Immigrants | Bosnia and Herzegovina | 99.7 /100 | #41 | Exceptional 4.8% |
| Filipinos | 99.5 /100 | #42 | Exceptional 4.8% |
| Yugoslavians | 99.5 /100 | #43 | Exceptional 4.8% |
| Austrians | 99.5 /100 | #44 | Exceptional 4.8% |
| French | 99.5 /100 | #45 | Exceptional 4.8% |
| Immigrants | Nepal | 99.4 /100 | #46 | Exceptional 4.8% |
| Immigrants | Taiwan | 99.4 /100 | #47 | Exceptional 4.8% |
| Immigrants | Scotland | 99.3 /100 | #48 | Exceptional 4.9% |