Immigrants from Belgium vs Chickasaw Unemployment Among Ages 60 to 64 years
COMPARE
Immigrants from Belgium
Chickasaw
Unemployment Among Ages 60 to 64 years
Unemployment Among Ages 60 to 64 years Comparison
Immigrants from Belgium
Chickasaw
4.8%
UNEMPLOYMENT AMONG AGES 60 TO 64 YEARS
64.8/ 100
METRIC RATING
163rd/ 347
METRIC RANK
4.3%
UNEMPLOYMENT AMONG AGES 60 TO 64 YEARS
100.0/ 100
METRIC RATING
13th/ 347
METRIC RANK
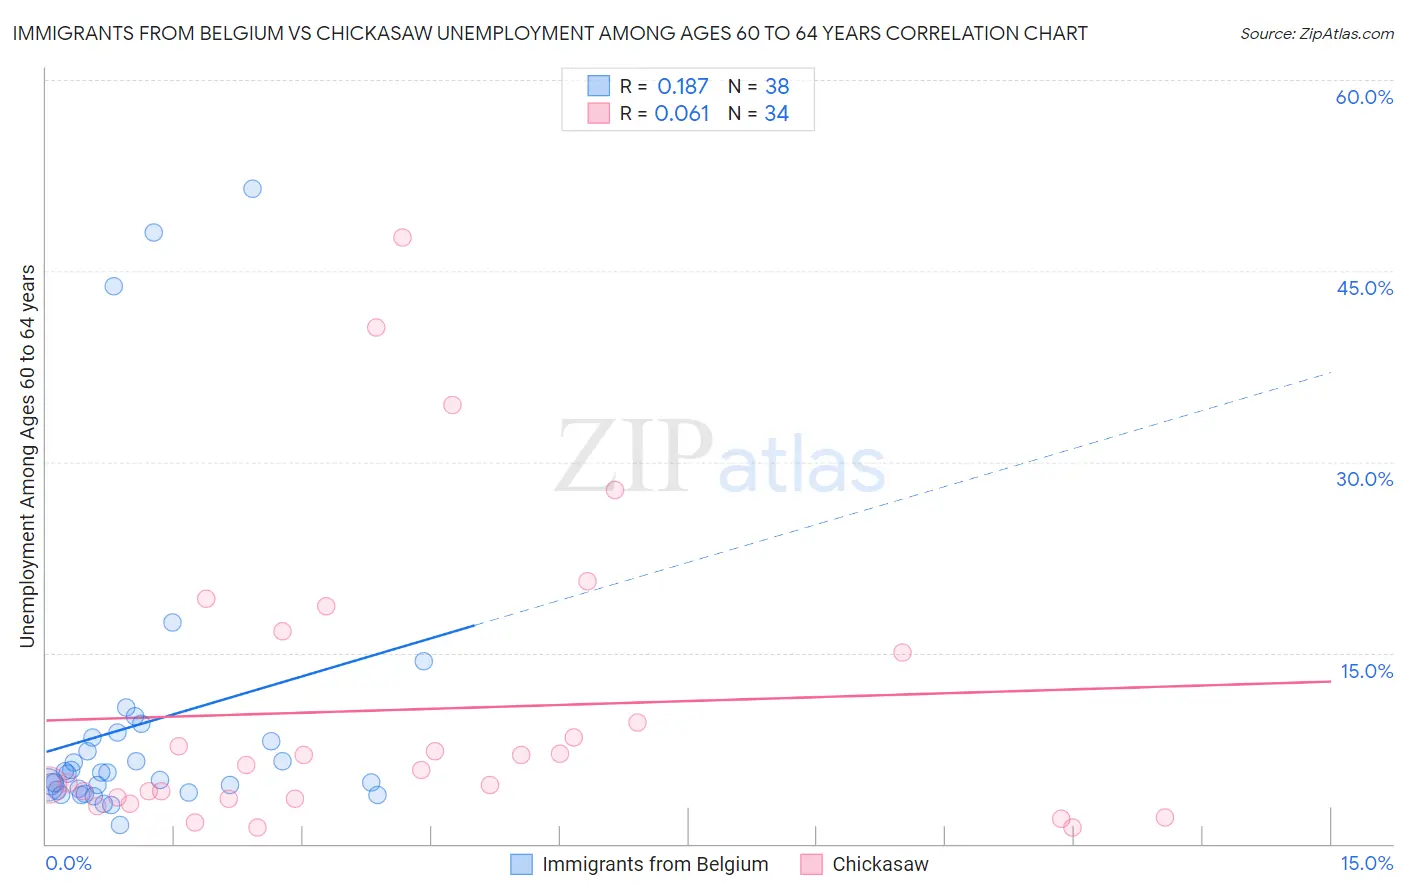
Immigrants from Belgium vs Chickasaw Unemployment Among Ages 60 to 64 years Correlation Chart
The statistical analysis conducted on geographies consisting of 141,110,799 people shows a poor positive correlation between the proportion of Immigrants from Belgium and unemployment rate among population between the ages 60 and 64 in the United States with a correlation coefficient (R) of 0.187 and weighted average of 4.8%. Similarly, the statistical analysis conducted on geographies consisting of 139,083,828 people shows a slight positive correlation between the proportion of Chickasaw and unemployment rate among population between the ages 60 and 64 in the United States with a correlation coefficient (R) of 0.061 and weighted average of 4.3%, a difference of 11.7%.
Unemployment Among Ages 60 to 64 years Correlation Summary
| Measurement | Immigrants from Belgium | Chickasaw |
| Minimum | 1.5% | 1.3% |
| Maximum | 51.5% | 47.6% |
| Range | 50.0% | 46.3% |
| Mean | 9.4% | 10.5% |
| Median | 5.5% | 6.0% |
| Interquartile 25% (IQ1) | 4.2% | 3.5% |
| Interquartile 75% (IQ3) | 8.4% | 15.0% |
| Interquartile Range (IQR) | 4.2% | 11.5% |
| Standard Deviation (Sample) | 11.8% | 11.6% |
| Standard Deviation (Population) | 11.7% | 11.4% |
Similar Demographics by Unemployment Among Ages 60 to 64 years
Demographics Similar to Immigrants from Belgium by Unemployment Among Ages 60 to 64 years
In terms of unemployment among ages 60 to 64 years, the demographic groups most similar to Immigrants from Belgium are Immigrants from Norway (4.8%, a difference of 0.010%), South African (4.8%, a difference of 0.010%), Pakistani (4.8%, a difference of 0.010%), Australian (4.8%, a difference of 0.020%), and Spanish (4.8%, a difference of 0.030%).
| Demographics | Rating | Rank | Unemployment Among Ages 60 to 64 years |
| Immigrants | Bolivia | 69.2 /100 | #156 | Good 4.8% |
| Laotians | 66.8 /100 | #157 | Good 4.8% |
| Immigrants | Taiwan | 66.0 /100 | #158 | Good 4.8% |
| Spanish | 65.5 /100 | #159 | Good 4.8% |
| Australians | 65.3 /100 | #160 | Good 4.8% |
| Immigrants | Norway | 65.1 /100 | #161 | Good 4.8% |
| South Africans | 65.1 /100 | #162 | Good 4.8% |
| Immigrants | Belgium | 64.8 /100 | #163 | Good 4.8% |
| Pakistanis | 64.6 /100 | #164 | Good 4.8% |
| Immigrants | Panama | 62.0 /100 | #165 | Good 4.8% |
| Palestinians | 60.5 /100 | #166 | Good 4.8% |
| Immigrants | Northern Europe | 59.1 /100 | #167 | Average 4.8% |
| Immigrants | Southern Europe | 56.7 /100 | #168 | Average 4.8% |
| Immigrants | France | 55.5 /100 | #169 | Average 4.8% |
| Immigrants | Korea | 54.2 /100 | #170 | Average 4.8% |
Demographics Similar to Chickasaw by Unemployment Among Ages 60 to 64 years
In terms of unemployment among ages 60 to 64 years, the demographic groups most similar to Chickasaw are Immigrants from Cuba (4.3%, a difference of 0.050%), Norwegian (4.3%, a difference of 0.050%), Sudanese (4.3%, a difference of 0.55%), Danish (4.4%, a difference of 0.81%), and Immigrants from Afghanistan (4.4%, a difference of 0.97%).
| Demographics | Rating | Rank | Unemployment Among Ages 60 to 64 years |
| Immigrants | Congo | 100.0 /100 | #6 | Exceptional 4.1% |
| Lumbee | 100.0 /100 | #7 | Exceptional 4.2% |
| Immigrants | Micronesia | 100.0 /100 | #8 | Exceptional 4.2% |
| Indonesians | 100.0 /100 | #9 | Exceptional 4.2% |
| Immigrants | Bosnia and Herzegovina | 100.0 /100 | #10 | Exceptional 4.2% |
| Luxembourgers | 100.0 /100 | #11 | Exceptional 4.3% |
| Immigrants | Cuba | 100.0 /100 | #12 | Exceptional 4.3% |
| Chickasaw | 100.0 /100 | #13 | Exceptional 4.3% |
| Norwegians | 100.0 /100 | #14 | Exceptional 4.3% |
| Sudanese | 100.0 /100 | #15 | Exceptional 4.3% |
| Danes | 100.0 /100 | #16 | Exceptional 4.4% |
| Immigrants | Afghanistan | 100.0 /100 | #17 | Exceptional 4.4% |
| Slovenes | 100.0 /100 | #18 | Exceptional 4.4% |
| Tsimshian | 100.0 /100 | #19 | Exceptional 4.4% |
| Afghans | 100.0 /100 | #20 | Exceptional 4.4% |