Immigrants from Belgium vs Immigrants from Sudan Unemployment Among Ages 60 to 64 years
COMPARE
Immigrants from Belgium
Immigrants from Sudan
Unemployment Among Ages 60 to 64 years
Unemployment Among Ages 60 to 64 years Comparison
Immigrants from Belgium
Immigrants from Sudan
4.8%
UNEMPLOYMENT AMONG AGES 60 TO 64 YEARS
64.8/ 100
METRIC RATING
163rd/ 347
METRIC RANK
4.5%
UNEMPLOYMENT AMONG AGES 60 TO 64 YEARS
100.0/ 100
METRIC RATING
41st/ 347
METRIC RANK
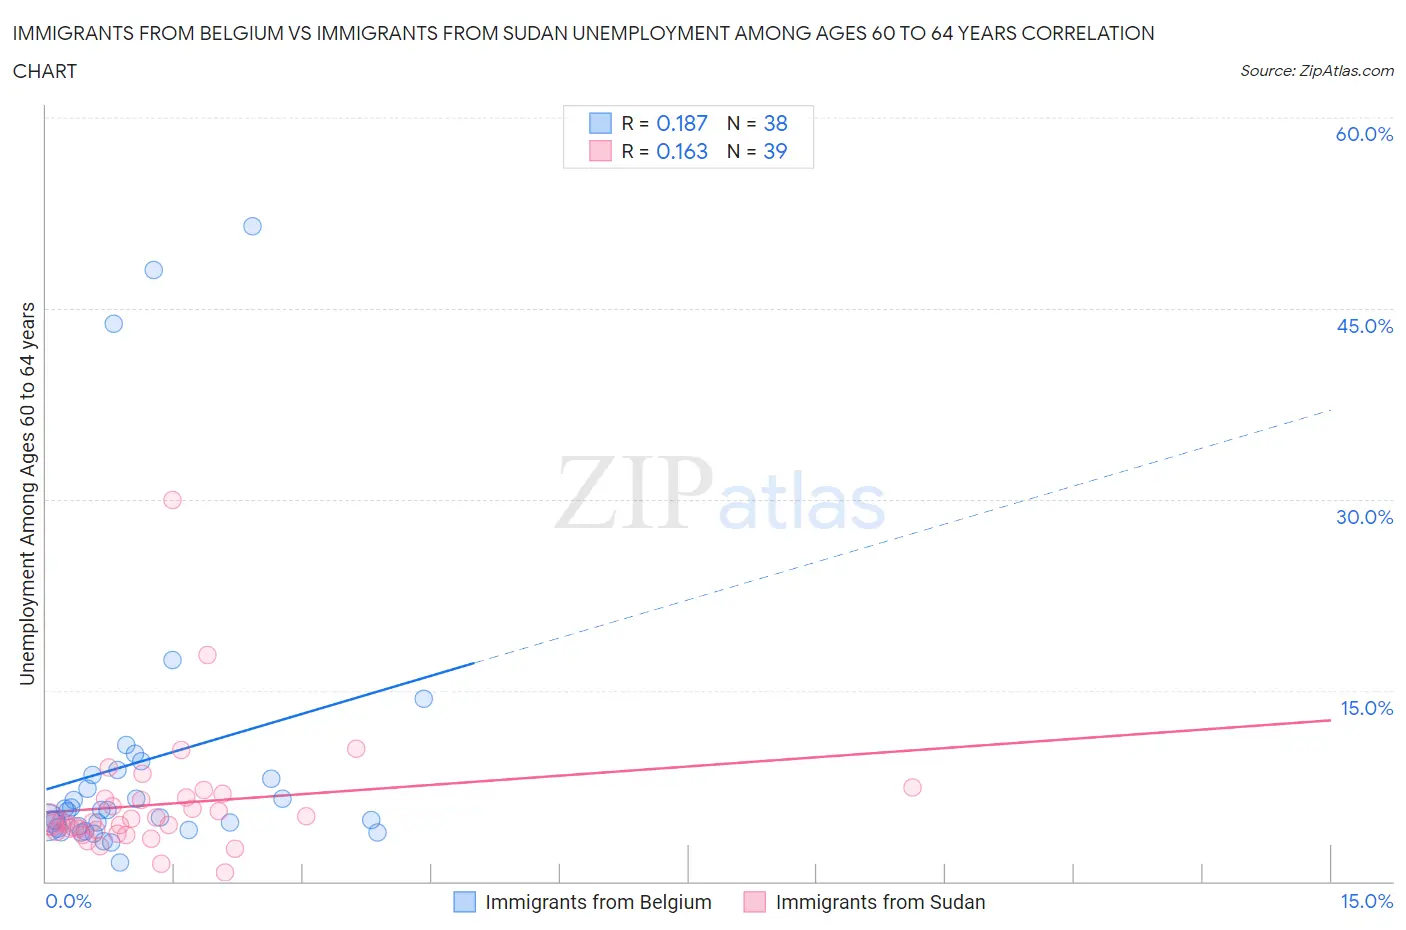
Immigrants from Belgium vs Immigrants from Sudan Unemployment Among Ages 60 to 64 years Correlation Chart
The statistical analysis conducted on geographies consisting of 141,110,799 people shows a poor positive correlation between the proportion of Immigrants from Belgium and unemployment rate among population between the ages 60 and 64 in the United States with a correlation coefficient (R) of 0.187 and weighted average of 4.8%. Similarly, the statistical analysis conducted on geographies consisting of 114,813,506 people shows a poor positive correlation between the proportion of Immigrants from Sudan and unemployment rate among population between the ages 60 and 64 in the United States with a correlation coefficient (R) of 0.163 and weighted average of 4.5%, a difference of 7.1%.
Unemployment Among Ages 60 to 64 years Correlation Summary
| Measurement | Immigrants from Belgium | Immigrants from Sudan |
| Minimum | 1.5% | 0.70% |
| Maximum | 51.5% | 30.0% |
| Range | 50.0% | 29.3% |
| Mean | 9.4% | 6.1% |
| Median | 5.5% | 4.7% |
| Interquartile 25% (IQ1) | 4.2% | 4.0% |
| Interquartile 75% (IQ3) | 8.4% | 6.6% |
| Interquartile Range (IQR) | 4.2% | 2.7% |
| Standard Deviation (Sample) | 11.8% | 4.9% |
| Standard Deviation (Population) | 11.7% | 4.8% |
Similar Demographics by Unemployment Among Ages 60 to 64 years
Demographics Similar to Immigrants from Belgium by Unemployment Among Ages 60 to 64 years
In terms of unemployment among ages 60 to 64 years, the demographic groups most similar to Immigrants from Belgium are Immigrants from Norway (4.8%, a difference of 0.010%), South African (4.8%, a difference of 0.010%), Pakistani (4.8%, a difference of 0.010%), Australian (4.8%, a difference of 0.020%), and Spanish (4.8%, a difference of 0.030%).
| Demographics | Rating | Rank | Unemployment Among Ages 60 to 64 years |
| Immigrants | Bolivia | 69.2 /100 | #156 | Good 4.8% |
| Laotians | 66.8 /100 | #157 | Good 4.8% |
| Immigrants | Taiwan | 66.0 /100 | #158 | Good 4.8% |
| Spanish | 65.5 /100 | #159 | Good 4.8% |
| Australians | 65.3 /100 | #160 | Good 4.8% |
| Immigrants | Norway | 65.1 /100 | #161 | Good 4.8% |
| South Africans | 65.1 /100 | #162 | Good 4.8% |
| Immigrants | Belgium | 64.8 /100 | #163 | Good 4.8% |
| Pakistanis | 64.6 /100 | #164 | Good 4.8% |
| Immigrants | Panama | 62.0 /100 | #165 | Good 4.8% |
| Palestinians | 60.5 /100 | #166 | Good 4.8% |
| Immigrants | Northern Europe | 59.1 /100 | #167 | Average 4.8% |
| Immigrants | Southern Europe | 56.7 /100 | #168 | Average 4.8% |
| Immigrants | France | 55.5 /100 | #169 | Average 4.8% |
| Immigrants | Korea | 54.2 /100 | #170 | Average 4.8% |
Demographics Similar to Immigrants from Sudan by Unemployment Among Ages 60 to 64 years
In terms of unemployment among ages 60 to 64 years, the demographic groups most similar to Immigrants from Sudan are English (4.5%, a difference of 0.050%), Scandinavian (4.5%, a difference of 0.13%), Swedish (4.5%, a difference of 0.22%), Native Hawaiian (4.5%, a difference of 0.27%), and Iraqi (4.5%, a difference of 0.27%).
| Demographics | Rating | Rank | Unemployment Among Ages 60 to 64 years |
| Belgians | 100.0 /100 | #34 | Exceptional 4.5% |
| Germans | 100.0 /100 | #35 | Exceptional 4.5% |
| Venezuelans | 100.0 /100 | #36 | Exceptional 4.5% |
| Immigrants | Portugal | 100.0 /100 | #37 | Exceptional 4.5% |
| Native Hawaiians | 100.0 /100 | #38 | Exceptional 4.5% |
| Iraqis | 100.0 /100 | #39 | Exceptional 4.5% |
| Scandinavians | 100.0 /100 | #40 | Exceptional 4.5% |
| Immigrants | Sudan | 100.0 /100 | #41 | Exceptional 4.5% |
| English | 100.0 /100 | #42 | Exceptional 4.5% |
| Swedes | 100.0 /100 | #43 | Exceptional 4.5% |
| Europeans | 100.0 /100 | #44 | Exceptional 4.5% |
| Liberians | 99.9 /100 | #45 | Exceptional 4.5% |
| Bhutanese | 99.9 /100 | #46 | Exceptional 4.5% |
| Assyrians/Chaldeans/Syriacs | 99.9 /100 | #47 | Exceptional 4.5% |
| Immigrants | Zimbabwe | 99.9 /100 | #48 | Exceptional 4.6% |