Black/African American vs Immigrants from Russia Unemployment Among Women with Children Ages 6 to 17 years
COMPARE
Black/African American
Immigrants from Russia
Unemployment Among Women with Children Ages 6 to 17 years
Unemployment Among Women with Children Ages 6 to 17 years Comparison
Blacks/African Americans
Immigrants from Russia
11.4%
UNEMPLOYMENT AMONG WOMEN WITH CHILDREN AGES 6 TO 17 YEARS
0.0/ 100
METRIC RATING
331st/ 347
METRIC RANK
8.6%
UNEMPLOYMENT AMONG WOMEN WITH CHILDREN AGES 6 TO 17 YEARS
96.7/ 100
METRIC RATING
114th/ 347
METRIC RANK
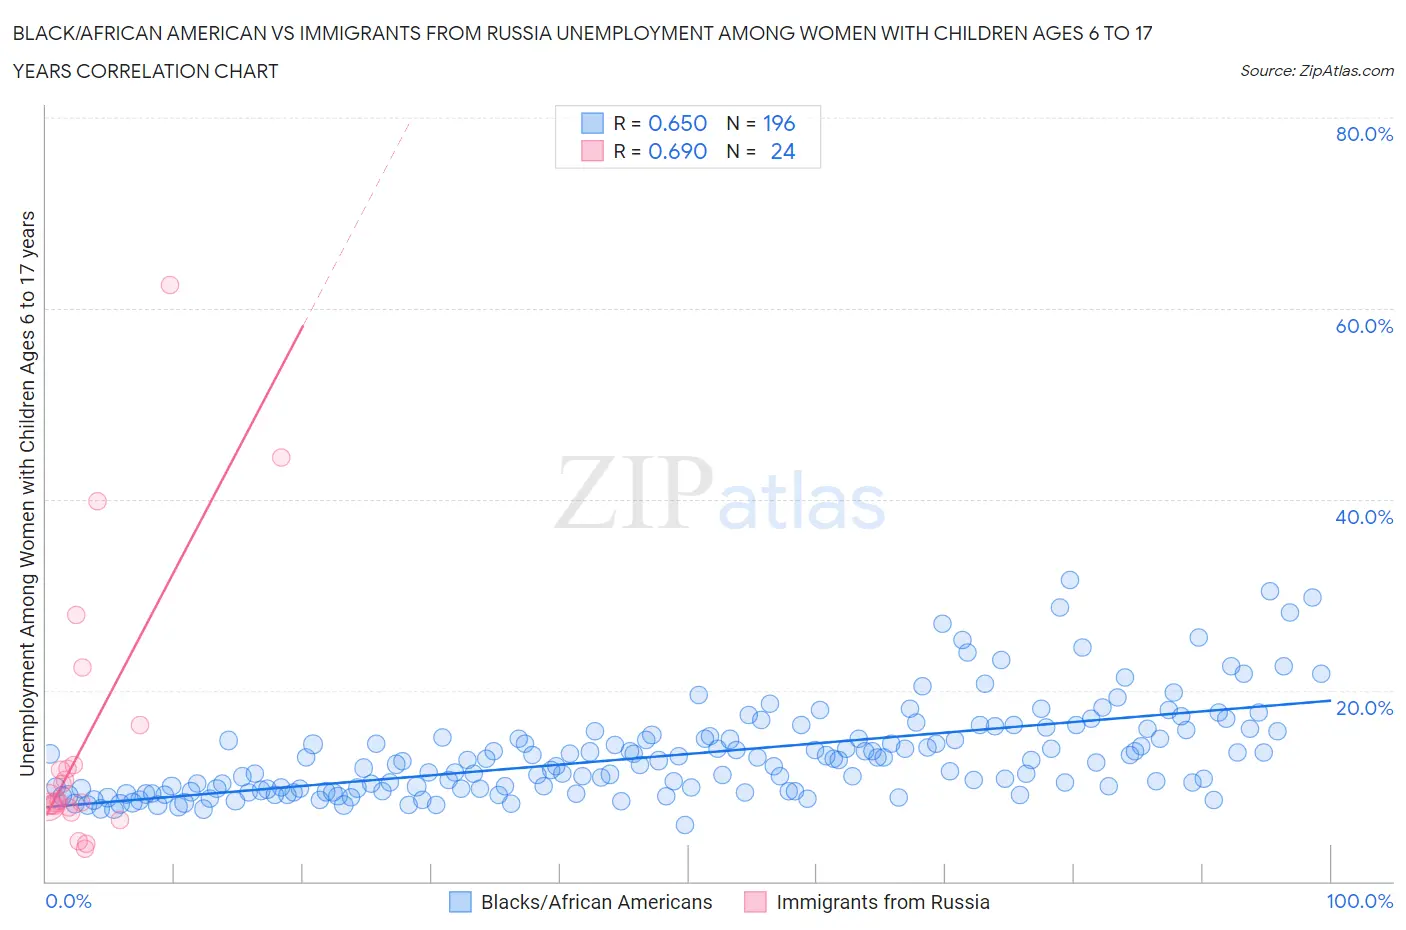
Black/African American vs Immigrants from Russia Unemployment Among Women with Children Ages 6 to 17 years Correlation Chart
The statistical analysis conducted on geographies consisting of 359,529,237 people shows a significant positive correlation between the proportion of Blacks/African Americans and unemployment rate among women with children between the ages 6 and 17 in the United States with a correlation coefficient (R) of 0.650 and weighted average of 11.4%. Similarly, the statistical analysis conducted on geographies consisting of 252,369,687 people shows a significant positive correlation between the proportion of Immigrants from Russia and unemployment rate among women with children between the ages 6 and 17 in the United States with a correlation coefficient (R) of 0.690 and weighted average of 8.6%, a difference of 31.9%.
Unemployment Among Women with Children Ages 6 to 17 years Correlation Summary
| Measurement | Black/African American | Immigrants from Russia |
| Minimum | 5.9% | 3.4% |
| Maximum | 31.6% | 62.5% |
| Range | 25.6% | 59.1% |
| Mean | 13.2% | 15.0% |
| Median | 12.3% | 8.4% |
| Interquartile 25% (IQ1) | 9.5% | 7.8% |
| Interquartile 75% (IQ3) | 15.0% | 14.3% |
| Interquartile Range (IQR) | 5.5% | 6.5% |
| Standard Deviation (Sample) | 4.9% | 14.6% |
| Standard Deviation (Population) | 4.9% | 14.3% |
Similar Demographics by Unemployment Among Women with Children Ages 6 to 17 years
Demographics Similar to Blacks/African Americans by Unemployment Among Women with Children Ages 6 to 17 years
In terms of unemployment among women with children ages 6 to 17 years, the demographic groups most similar to Blacks/African Americans are Tsimshian (11.4%, a difference of 0.11%), Native/Alaskan (11.5%, a difference of 0.74%), Chippewa (11.1%, a difference of 2.6%), Pennsylvania German (11.0%, a difference of 3.1%), and Ottawa (10.9%, a difference of 4.6%).
| Demographics | Rating | Rank | Unemployment Among Women with Children Ages 6 to 17 years |
| Immigrants | Dominican Republic | 0.0 /100 | #324 | Tragic 10.8% |
| Cajuns | 0.0 /100 | #325 | Tragic 10.8% |
| Liberians | 0.0 /100 | #326 | Tragic 10.8% |
| Cape Verdeans | 0.0 /100 | #327 | Tragic 10.9% |
| Ottawa | 0.0 /100 | #328 | Tragic 10.9% |
| Pennsylvania Germans | 0.0 /100 | #329 | Tragic 11.0% |
| Chippewa | 0.0 /100 | #330 | Tragic 11.1% |
| Blacks/African Americans | 0.0 /100 | #331 | Tragic 11.4% |
| Tsimshian | 0.0 /100 | #332 | Tragic 11.4% |
| Natives/Alaskans | 0.0 /100 | #333 | Tragic 11.5% |
| Ugandans | 0.0 /100 | #334 | Tragic 12.0% |
| Colville | 0.0 /100 | #335 | Tragic 12.3% |
| Houma | 0.0 /100 | #336 | Tragic 12.5% |
| Immigrants | Yemen | 0.0 /100 | #337 | Tragic 12.7% |
| Hopi | 0.0 /100 | #338 | Tragic 12.9% |
Demographics Similar to Immigrants from Russia by Unemployment Among Women with Children Ages 6 to 17 years
In terms of unemployment among women with children ages 6 to 17 years, the demographic groups most similar to Immigrants from Russia are Eastern European (8.6%, a difference of 0.010%), Argentinean (8.6%, a difference of 0.070%), Zimbabwean (8.6%, a difference of 0.14%), Albanian (8.6%, a difference of 0.15%), and Romanian (8.6%, a difference of 0.16%).
| Demographics | Rating | Rank | Unemployment Among Women with Children Ages 6 to 17 years |
| Chickasaw | 97.6 /100 | #107 | Exceptional 8.6% |
| Swedes | 97.6 /100 | #108 | Exceptional 8.6% |
| Immigrants | Romania | 97.5 /100 | #109 | Exceptional 8.6% |
| Latvians | 97.4 /100 | #110 | Exceptional 8.6% |
| Immigrants | Ukraine | 97.4 /100 | #111 | Exceptional 8.6% |
| Romanians | 97.1 /100 | #112 | Exceptional 8.6% |
| Eastern Europeans | 96.8 /100 | #113 | Exceptional 8.6% |
| Immigrants | Russia | 96.7 /100 | #114 | Exceptional 8.6% |
| Argentineans | 96.5 /100 | #115 | Exceptional 8.6% |
| Zimbabweans | 96.3 /100 | #116 | Exceptional 8.6% |
| Albanians | 96.3 /100 | #117 | Exceptional 8.6% |
| Pueblo | 96.2 /100 | #118 | Exceptional 8.6% |
| Immigrants | Grenada | 96.2 /100 | #119 | Exceptional 8.6% |
| Israelis | 95.9 /100 | #120 | Exceptional 8.7% |
| Immigrants | Denmark | 95.5 /100 | #121 | Exceptional 8.7% |