Alaska Native vs Immigrants from Russia Unemployment Among Women with Children Ages 6 to 17 years
COMPARE
Alaska Native
Immigrants from Russia
Unemployment Among Women with Children Ages 6 to 17 years
Unemployment Among Women with Children Ages 6 to 17 years Comparison
Alaska Natives
Immigrants from Russia
10.3%
UNEMPLOYMENT AMONG WOMEN WITH CHILDREN AGES 6 TO 17 YEARS
0.0/ 100
METRIC RATING
310th/ 347
METRIC RANK
8.6%
UNEMPLOYMENT AMONG WOMEN WITH CHILDREN AGES 6 TO 17 YEARS
96.7/ 100
METRIC RATING
114th/ 347
METRIC RANK
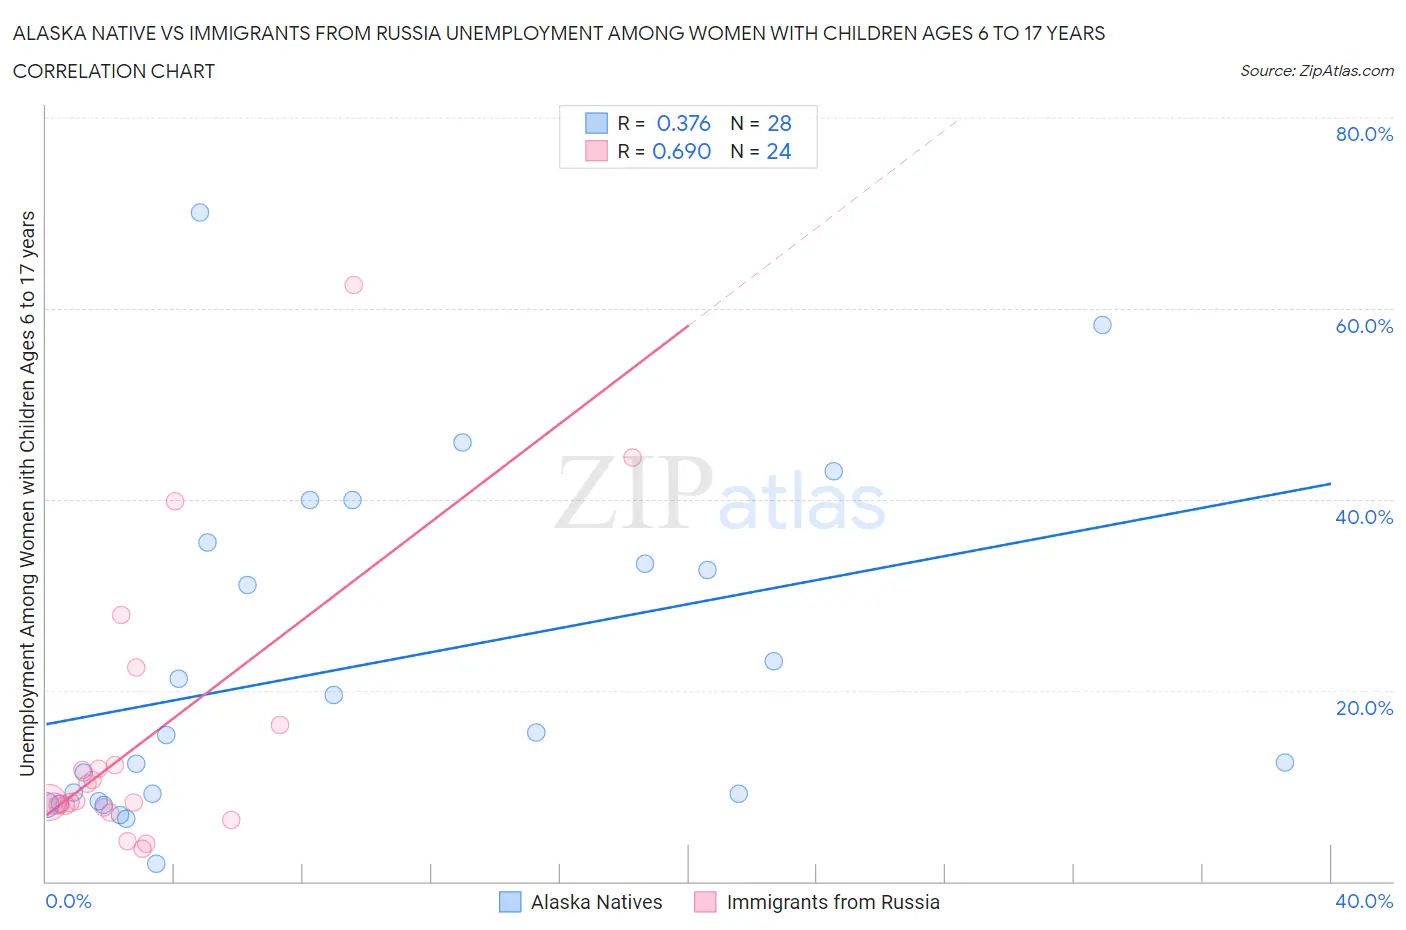
Alaska Native vs Immigrants from Russia Unemployment Among Women with Children Ages 6 to 17 years Correlation Chart
The statistical analysis conducted on geographies consisting of 69,081,648 people shows a mild positive correlation between the proportion of Alaska Natives and unemployment rate among women with children between the ages 6 and 17 in the United States with a correlation coefficient (R) of 0.376 and weighted average of 10.3%. Similarly, the statistical analysis conducted on geographies consisting of 252,369,687 people shows a significant positive correlation between the proportion of Immigrants from Russia and unemployment rate among women with children between the ages 6 and 17 in the United States with a correlation coefficient (R) of 0.690 and weighted average of 8.6%, a difference of 19.5%.
Unemployment Among Women with Children Ages 6 to 17 years Correlation Summary
| Measurement | Alaska Native | Immigrants from Russia |
| Minimum | 1.9% | 3.4% |
| Maximum | 70.0% | 62.5% |
| Range | 68.1% | 59.1% |
| Mean | 22.7% | 15.0% |
| Median | 15.4% | 8.4% |
| Interquartile 25% (IQ1) | 8.8% | 7.8% |
| Interquartile 75% (IQ3) | 34.4% | 14.3% |
| Interquartile Range (IQR) | 25.6% | 6.5% |
| Standard Deviation (Sample) | 17.5% | 14.6% |
| Standard Deviation (Population) | 17.2% | 14.3% |
Similar Demographics by Unemployment Among Women with Children Ages 6 to 17 years
Demographics Similar to Alaska Natives by Unemployment Among Women with Children Ages 6 to 17 years
In terms of unemployment among women with children ages 6 to 17 years, the demographic groups most similar to Alaska Natives are Immigrants from Liberia (10.3%, a difference of 0.030%), French Canadian (10.3%, a difference of 0.050%), Dutch West Indian (10.2%, a difference of 0.59%), Immigrants from Senegal (10.2%, a difference of 0.61%), and Paraguayan (10.2%, a difference of 0.84%).
| Demographics | Rating | Rank | Unemployment Among Women with Children Ages 6 to 17 years |
| Immigrants | Ecuador | 0.0 /100 | #303 | Tragic 10.2% |
| Immigrants | Venezuela | 0.0 /100 | #304 | Tragic 10.2% |
| Immigrants | Nigeria | 0.0 /100 | #305 | Tragic 10.2% |
| Paraguayans | 0.0 /100 | #306 | Tragic 10.2% |
| Immigrants | Senegal | 0.0 /100 | #307 | Tragic 10.2% |
| Dutch West Indians | 0.0 /100 | #308 | Tragic 10.2% |
| French Canadians | 0.0 /100 | #309 | Tragic 10.3% |
| Alaska Natives | 0.0 /100 | #310 | Tragic 10.3% |
| Immigrants | Liberia | 0.0 /100 | #311 | Tragic 10.3% |
| Africans | 0.0 /100 | #312 | Tragic 10.4% |
| Americans | 0.0 /100 | #313 | Tragic 10.4% |
| Immigrants | Cabo Verde | 0.0 /100 | #314 | Tragic 10.4% |
| Bahamians | 0.0 /100 | #315 | Tragic 10.4% |
| Immigrants | Dominica | 0.0 /100 | #316 | Tragic 10.5% |
| Bermudans | 0.0 /100 | #317 | Tragic 10.5% |
Demographics Similar to Immigrants from Russia by Unemployment Among Women with Children Ages 6 to 17 years
In terms of unemployment among women with children ages 6 to 17 years, the demographic groups most similar to Immigrants from Russia are Eastern European (8.6%, a difference of 0.010%), Argentinean (8.6%, a difference of 0.070%), Zimbabwean (8.6%, a difference of 0.14%), Albanian (8.6%, a difference of 0.15%), and Romanian (8.6%, a difference of 0.16%).
| Demographics | Rating | Rank | Unemployment Among Women with Children Ages 6 to 17 years |
| Chickasaw | 97.6 /100 | #107 | Exceptional 8.6% |
| Swedes | 97.6 /100 | #108 | Exceptional 8.6% |
| Immigrants | Romania | 97.5 /100 | #109 | Exceptional 8.6% |
| Latvians | 97.4 /100 | #110 | Exceptional 8.6% |
| Immigrants | Ukraine | 97.4 /100 | #111 | Exceptional 8.6% |
| Romanians | 97.1 /100 | #112 | Exceptional 8.6% |
| Eastern Europeans | 96.8 /100 | #113 | Exceptional 8.6% |
| Immigrants | Russia | 96.7 /100 | #114 | Exceptional 8.6% |
| Argentineans | 96.5 /100 | #115 | Exceptional 8.6% |
| Zimbabweans | 96.3 /100 | #116 | Exceptional 8.6% |
| Albanians | 96.3 /100 | #117 | Exceptional 8.6% |
| Pueblo | 96.2 /100 | #118 | Exceptional 8.6% |
| Immigrants | Grenada | 96.2 /100 | #119 | Exceptional 8.6% |
| Israelis | 95.9 /100 | #120 | Exceptional 8.7% |
| Immigrants | Denmark | 95.5 /100 | #121 | Exceptional 8.7% |