Immigrants from Asia vs Cypriot Unemployment
COMPARE
Immigrants from Asia
Cypriot
Unemployment
Unemployment Comparison
Immigrants from Asia
Cypriots
5.1%
UNEMPLOYMENT
81.8/ 100
METRIC RATING
146th/ 347
METRIC RANK
4.9%
UNEMPLOYMENT
97.9/ 100
METRIC RATING
77th/ 347
METRIC RANK
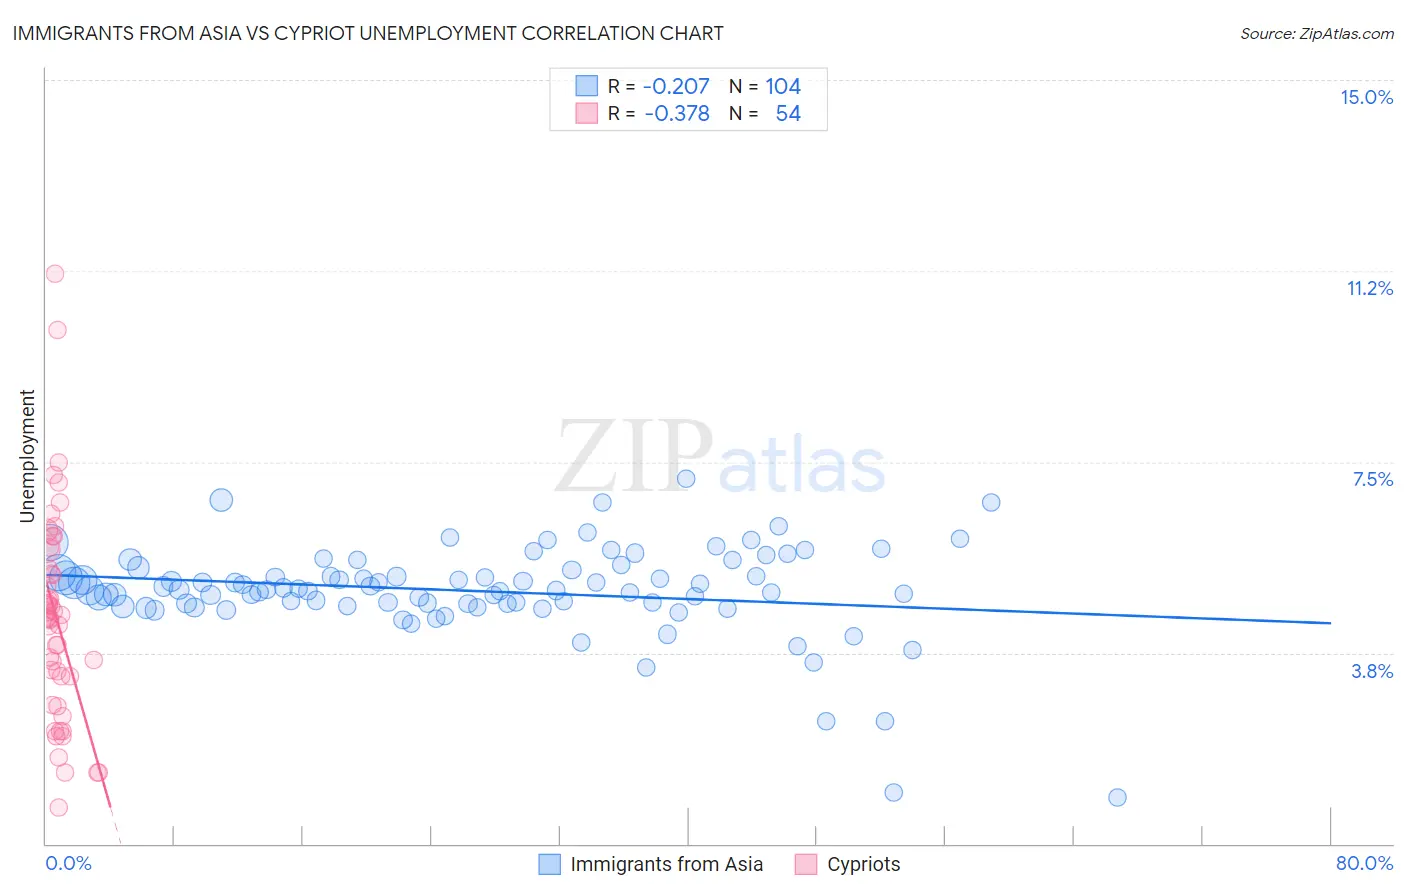
Immigrants from Asia vs Cypriot Unemployment Correlation Chart
The statistical analysis conducted on geographies consisting of 547,060,579 people shows a weak negative correlation between the proportion of Immigrants from Asia and unemployment in the United States with a correlation coefficient (R) of -0.207 and weighted average of 5.1%. Similarly, the statistical analysis conducted on geographies consisting of 61,864,376 people shows a mild negative correlation between the proportion of Cypriots and unemployment in the United States with a correlation coefficient (R) of -0.378 and weighted average of 4.9%, a difference of 3.8%.
Unemployment Correlation Summary
| Measurement | Immigrants from Asia | Cypriot |
| Minimum | 0.90% | 0.70% |
| Maximum | 7.2% | 11.2% |
| Range | 6.3% | 10.5% |
| Mean | 5.0% | 4.4% |
| Median | 5.0% | 4.4% |
| Interquartile 25% (IQ1) | 4.7% | 3.3% |
| Interquartile 75% (IQ3) | 5.4% | 5.4% |
| Interquartile Range (IQR) | 0.65% | 2.1% |
| Standard Deviation (Sample) | 0.92% | 2.0% |
| Standard Deviation (Population) | 0.92% | 2.0% |
Similar Demographics by Unemployment
Demographics Similar to Immigrants from Asia by Unemployment
In terms of unemployment, the demographic groups most similar to Immigrants from Asia are Immigrants from Norway (5.1%, a difference of 0.0%), Indian (Asian) (5.1%, a difference of 0.010%), Indonesian (5.1%, a difference of 0.060%), Immigrants from Chile (5.1%, a difference of 0.11%), and Immigrants from Pakistan (5.1%, a difference of 0.16%).
| Demographics | Rating | Rank | Unemployment |
| Pakistanis | 85.3 /100 | #139 | Excellent 5.1% |
| Immigrants | Denmark | 84.3 /100 | #140 | Excellent 5.1% |
| Palestinians | 83.4 /100 | #141 | Excellent 5.1% |
| Immigrants | Pakistan | 83.2 /100 | #142 | Excellent 5.1% |
| Immigrants | Chile | 82.8 /100 | #143 | Excellent 5.1% |
| Indonesians | 82.3 /100 | #144 | Excellent 5.1% |
| Immigrants | Norway | 81.8 /100 | #145 | Excellent 5.1% |
| Immigrants | Asia | 81.8 /100 | #146 | Excellent 5.1% |
| Indians (Asian) | 81.6 /100 | #147 | Excellent 5.1% |
| Immigrants | Italy | 79.1 /100 | #148 | Good 5.1% |
| Syrians | 77.7 /100 | #149 | Good 5.2% |
| Potawatomi | 76.2 /100 | #150 | Good 5.2% |
| Immigrants | Eastern Europe | 75.3 /100 | #151 | Good 5.2% |
| Immigrants | Hong Kong | 75.2 /100 | #152 | Good 5.2% |
| Egyptians | 75.2 /100 | #153 | Good 5.2% |
Demographics Similar to Cypriots by Unemployment
In terms of unemployment, the demographic groups most similar to Cypriots are Okinawan (4.9%, a difference of 0.040%), German Russian (4.9%, a difference of 0.060%), Turkish (4.9%, a difference of 0.080%), Canadian (5.0%, a difference of 0.16%), and Immigrants from Northern Europe (4.9%, a difference of 0.22%).
| Demographics | Rating | Rank | Unemployment |
| Serbians | 98.4 /100 | #70 | Exceptional 4.9% |
| Immigrants | Japan | 98.3 /100 | #71 | Exceptional 4.9% |
| Burmese | 98.3 /100 | #72 | Exceptional 4.9% |
| Paraguayans | 98.3 /100 | #73 | Exceptional 4.9% |
| Immigrants | Northern Europe | 98.2 /100 | #74 | Exceptional 4.9% |
| Turks | 98.0 /100 | #75 | Exceptional 4.9% |
| German Russians | 98.0 /100 | #76 | Exceptional 4.9% |
| Cypriots | 97.9 /100 | #77 | Exceptional 4.9% |
| Okinawans | 97.9 /100 | #78 | Exceptional 4.9% |
| Canadians | 97.7 /100 | #79 | Exceptional 5.0% |
| Immigrants | Sweden | 97.6 /100 | #80 | Exceptional 5.0% |
| Basques | 97.6 /100 | #81 | Exceptional 5.0% |
| Fijians | 97.6 /100 | #82 | Exceptional 5.0% |
| Hmong | 97.6 /100 | #83 | Exceptional 5.0% |
| Russians | 97.4 /100 | #84 | Exceptional 5.0% |