Immigrants from Asia vs Mongolian Per Capita Income
COMPARE
Immigrants from Asia
Mongolian
Per Capita Income
Per Capita Income Comparison
Immigrants from Asia
Mongolians
$49,741
PER CAPITA INCOME
99.9/ 100
METRIC RATING
62nd/ 347
METRIC RANK
$49,173
PER CAPITA INCOME
99.8/ 100
METRIC RATING
74th/ 347
METRIC RANK
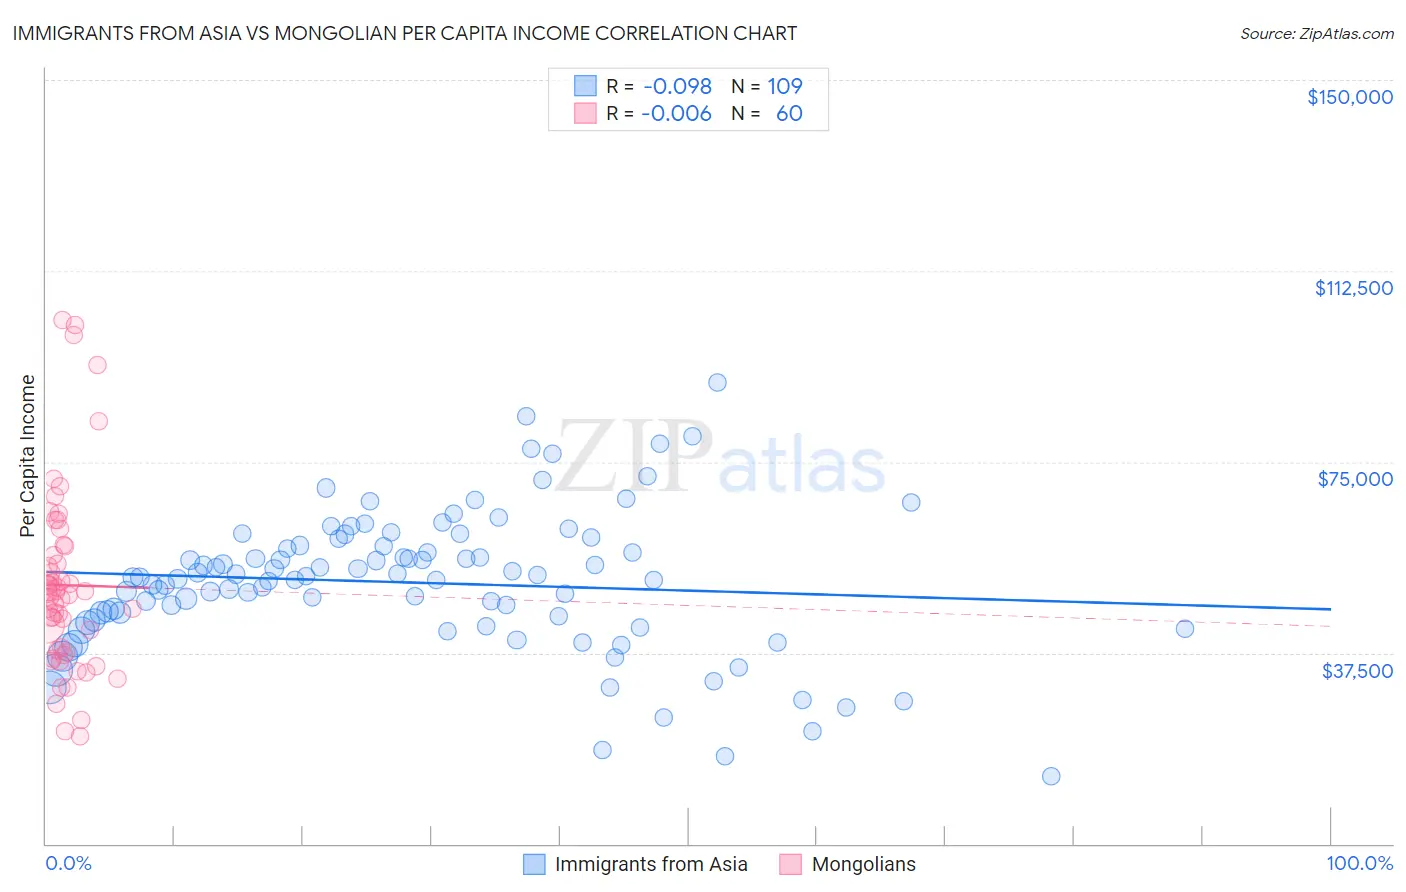
Immigrants from Asia vs Mongolian Per Capita Income Correlation Chart
The statistical analysis conducted on geographies consisting of 549,218,317 people shows a slight negative correlation between the proportion of Immigrants from Asia and per capita income in the United States with a correlation coefficient (R) of -0.098 and weighted average of $49,741. Similarly, the statistical analysis conducted on geographies consisting of 140,356,705 people shows no correlation between the proportion of Mongolians and per capita income in the United States with a correlation coefficient (R) of -0.006 and weighted average of $49,173, a difference of 1.1%.
Per Capita Income Correlation Summary
| Measurement | Immigrants from Asia | Mongolian |
| Minimum | $13,219 | $21,025 |
| Maximum | $90,491 | $102,845 |
| Range | $77,273 | $81,820 |
| Mean | $51,284 | $50,803 |
| Median | $52,258 | $49,216 |
| Interquartile 25% (IQ1) | $43,660 | $37,778 |
| Interquartile 75% (IQ3) | $58,564 | $57,579 |
| Interquartile Range (IQR) | $14,904 | $19,802 |
| Standard Deviation (Sample) | $13,798 | $18,159 |
| Standard Deviation (Population) | $13,734 | $18,007 |
Demographics Similar to Immigrants from Asia and Mongolians by Per Capita Income
In terms of per capita income, the demographic groups most similar to Immigrants from Asia are Maltese ($49,640, a difference of 0.20%), Immigrants from Argentina ($49,627, a difference of 0.23%), Argentinean ($49,862, a difference of 0.24%), Bhutanese ($49,894, a difference of 0.31%), and Immigrants from Scotland ($49,893, a difference of 0.31%). Similarly, the demographic groups most similar to Mongolians are Immigrants from Hungary ($49,303, a difference of 0.26%), Immigrants from North America ($49,302, a difference of 0.26%), Greek ($49,309, a difference of 0.28%), Immigrants from Eastern Europe ($49,316, a difference of 0.29%), and Immigrants from Bolivia ($48,970, a difference of 0.41%).
| Demographics | Rating | Rank | Per Capita Income |
| Immigrants | Malaysia | 99.9 /100 | #58 | Exceptional $49,983 |
| Bhutanese | 99.9 /100 | #59 | Exceptional $49,894 |
| Immigrants | Scotland | 99.9 /100 | #60 | Exceptional $49,893 |
| Argentineans | 99.9 /100 | #61 | Exceptional $49,862 |
| Immigrants | Asia | 99.9 /100 | #62 | Exceptional $49,741 |
| Maltese | 99.9 /100 | #63 | Exceptional $49,640 |
| Immigrants | Argentina | 99.9 /100 | #64 | Exceptional $49,627 |
| Bolivians | 99.9 /100 | #65 | Exceptional $49,526 |
| Immigrants | Bulgaria | 99.9 /100 | #66 | Exceptional $49,482 |
| Immigrants | Romania | 99.9 /100 | #67 | Exceptional $49,463 |
| Lithuanians | 99.8 /100 | #68 | Exceptional $49,448 |
| Immigrants | Canada | 99.8 /100 | #69 | Exceptional $49,412 |
| Immigrants | Eastern Europe | 99.8 /100 | #70 | Exceptional $49,316 |
| Greeks | 99.8 /100 | #71 | Exceptional $49,309 |
| Immigrants | Hungary | 99.8 /100 | #72 | Exceptional $49,303 |
| Immigrants | North America | 99.8 /100 | #73 | Exceptional $49,302 |
| Mongolians | 99.8 /100 | #74 | Exceptional $49,173 |
| Immigrants | Bolivia | 99.7 /100 | #75 | Exceptional $48,970 |
| Immigrants | England | 99.7 /100 | #76 | Exceptional $48,844 |
| Immigrants | Kazakhstan | 99.7 /100 | #77 | Exceptional $48,747 |
| Immigrants | Italy | 99.6 /100 | #78 | Exceptional $48,654 |