Immigrants from Asia vs Immigrants from Scotland Unemployment
COMPARE
Immigrants from Asia
Immigrants from Scotland
Unemployment
Unemployment Comparison
Immigrants from Asia
Immigrants from Scotland
5.1%
UNEMPLOYMENT
81.8/ 100
METRIC RATING
146th/ 347
METRIC RANK
4.9%
UNEMPLOYMENT
99.3/ 100
METRIC RATING
48th/ 347
METRIC RANK
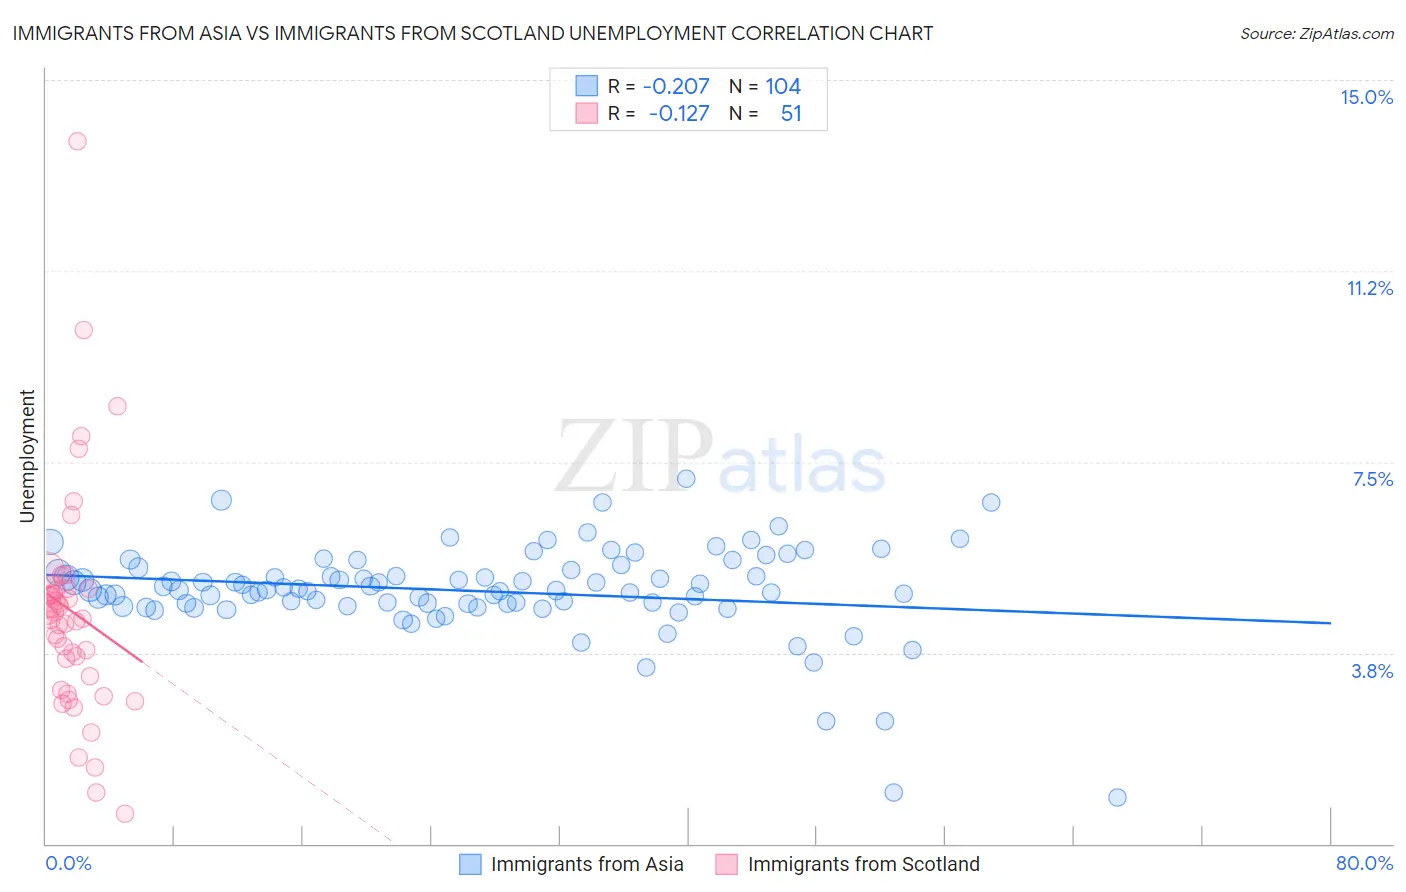
Immigrants from Asia vs Immigrants from Scotland Unemployment Correlation Chart
The statistical analysis conducted on geographies consisting of 547,060,579 people shows a weak negative correlation between the proportion of Immigrants from Asia and unemployment in the United States with a correlation coefficient (R) of -0.207 and weighted average of 5.1%. Similarly, the statistical analysis conducted on geographies consisting of 196,312,940 people shows a poor negative correlation between the proportion of Immigrants from Scotland and unemployment in the United States with a correlation coefficient (R) of -0.127 and weighted average of 4.9%, a difference of 5.8%.
Unemployment Correlation Summary
| Measurement | Immigrants from Asia | Immigrants from Scotland |
| Minimum | 0.90% | 0.60% |
| Maximum | 7.2% | 13.8% |
| Range | 6.3% | 13.2% |
| Mean | 5.0% | 4.6% |
| Median | 5.0% | 4.5% |
| Interquartile 25% (IQ1) | 4.7% | 3.3% |
| Interquartile 75% (IQ3) | 5.4% | 5.0% |
| Interquartile Range (IQR) | 0.65% | 1.7% |
| Standard Deviation (Sample) | 0.92% | 2.2% |
| Standard Deviation (Population) | 0.92% | 2.2% |
Similar Demographics by Unemployment
Demographics Similar to Immigrants from Asia by Unemployment
In terms of unemployment, the demographic groups most similar to Immigrants from Asia are Immigrants from Norway (5.1%, a difference of 0.0%), Indian (Asian) (5.1%, a difference of 0.010%), Indonesian (5.1%, a difference of 0.060%), Immigrants from Chile (5.1%, a difference of 0.11%), and Immigrants from Pakistan (5.1%, a difference of 0.16%).
| Demographics | Rating | Rank | Unemployment |
| Pakistanis | 85.3 /100 | #139 | Excellent 5.1% |
| Immigrants | Denmark | 84.3 /100 | #140 | Excellent 5.1% |
| Palestinians | 83.4 /100 | #141 | Excellent 5.1% |
| Immigrants | Pakistan | 83.2 /100 | #142 | Excellent 5.1% |
| Immigrants | Chile | 82.8 /100 | #143 | Excellent 5.1% |
| Indonesians | 82.3 /100 | #144 | Excellent 5.1% |
| Immigrants | Norway | 81.8 /100 | #145 | Excellent 5.1% |
| Immigrants | Asia | 81.8 /100 | #146 | Excellent 5.1% |
| Indians (Asian) | 81.6 /100 | #147 | Excellent 5.1% |
| Immigrants | Italy | 79.1 /100 | #148 | Good 5.1% |
| Syrians | 77.7 /100 | #149 | Good 5.2% |
| Potawatomi | 76.2 /100 | #150 | Good 5.2% |
| Immigrants | Eastern Europe | 75.3 /100 | #151 | Good 5.2% |
| Immigrants | Hong Kong | 75.2 /100 | #152 | Good 5.2% |
| Egyptians | 75.2 /100 | #153 | Good 5.2% |
Demographics Similar to Immigrants from Scotland by Unemployment
In terms of unemployment, the demographic groups most similar to Immigrants from Scotland are Immigrants from South Central Asia (4.9%, a difference of 0.010%), French Canadian (4.9%, a difference of 0.030%), Immigrants from Belgium (4.9%, a difference of 0.19%), White/Caucasian (4.9%, a difference of 0.20%), and Immigrants from Taiwan (4.8%, a difference of 0.22%).
| Demographics | Rating | Rank | Unemployment |
| Immigrants | Bosnia and Herzegovina | 99.7 /100 | #41 | Exceptional 4.8% |
| Filipinos | 99.5 /100 | #42 | Exceptional 4.8% |
| Yugoslavians | 99.5 /100 | #43 | Exceptional 4.8% |
| Austrians | 99.5 /100 | #44 | Exceptional 4.8% |
| French | 99.5 /100 | #45 | Exceptional 4.8% |
| Immigrants | Nepal | 99.4 /100 | #46 | Exceptional 4.8% |
| Immigrants | Taiwan | 99.4 /100 | #47 | Exceptional 4.8% |
| Immigrants | Scotland | 99.3 /100 | #48 | Exceptional 4.9% |
| Immigrants | South Central Asia | 99.3 /100 | #49 | Exceptional 4.9% |
| French Canadians | 99.3 /100 | #50 | Exceptional 4.9% |
| Immigrants | Belgium | 99.2 /100 | #51 | Exceptional 4.9% |
| Whites/Caucasians | 99.2 /100 | #52 | Exceptional 4.9% |
| Immigrants | Zimbabwe | 99.2 /100 | #53 | Exceptional 4.9% |
| Eastern Europeans | 99.2 /100 | #54 | Exceptional 4.9% |
| Australians | 99.2 /100 | #55 | Exceptional 4.9% |