Hungarian vs Immigrants from Africa Unemployment
COMPARE
Hungarian
Immigrants from Africa
Unemployment
Unemployment Comparison
Hungarians
Immigrants from Africa
5.0%
UNEMPLOYMENT
96.9/ 100
METRIC RATING
86th/ 347
METRIC RANK
5.5%
UNEMPLOYMENT
4.9/ 100
METRIC RATING
231st/ 347
METRIC RANK
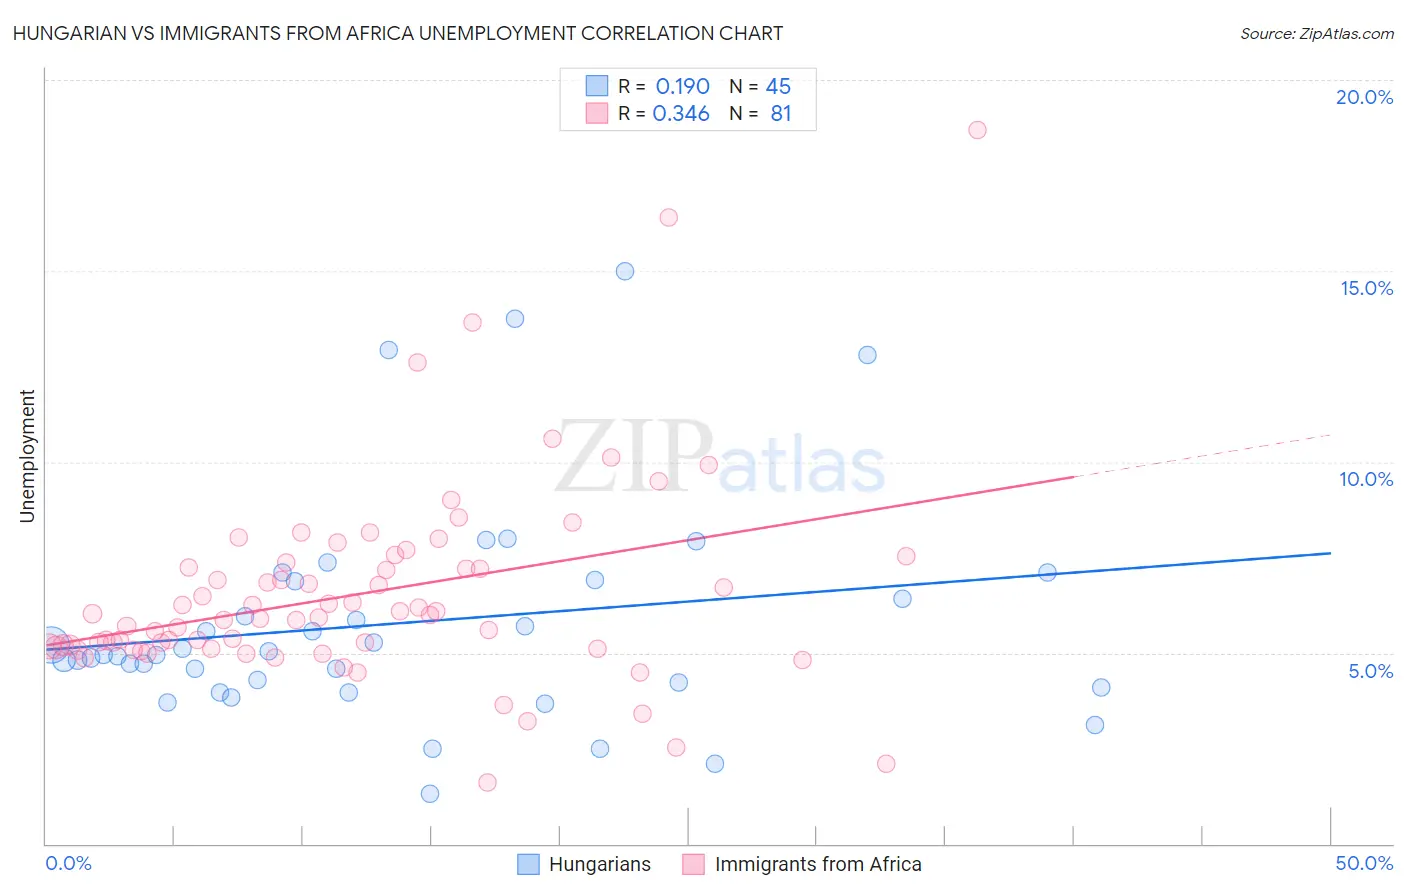
Hungarian vs Immigrants from Africa Unemployment Correlation Chart
The statistical analysis conducted on geographies consisting of 485,022,206 people shows a poor positive correlation between the proportion of Hungarians and unemployment in the United States with a correlation coefficient (R) of 0.190 and weighted average of 5.0%. Similarly, the statistical analysis conducted on geographies consisting of 468,788,801 people shows a mild positive correlation between the proportion of Immigrants from Africa and unemployment in the United States with a correlation coefficient (R) of 0.346 and weighted average of 5.5%, a difference of 10.4%.
Unemployment Correlation Summary
| Measurement | Hungarian | Immigrants from Africa |
| Minimum | 1.3% | 1.6% |
| Maximum | 15.0% | 18.7% |
| Range | 13.7% | 17.1% |
| Mean | 5.8% | 6.5% |
| Median | 4.9% | 5.9% |
| Interquartile 25% (IQ1) | 4.2% | 5.1% |
| Interquartile 75% (IQ3) | 6.9% | 7.3% |
| Interquartile Range (IQR) | 2.7% | 2.2% |
| Standard Deviation (Sample) | 2.9% | 2.7% |
| Standard Deviation (Population) | 2.9% | 2.6% |
Similar Demographics by Unemployment
Demographics Similar to Hungarians by Unemployment
In terms of unemployment, the demographic groups most similar to Hungarians are Immigrants from Australia (5.0%, a difference of 0.030%), Immigrants from Moldova (5.0%, a difference of 0.15%), Immigrants from Korea (5.0%, a difference of 0.18%), Jordanian (5.0%, a difference of 0.27%), and Russian (5.0%, a difference of 0.31%).
| Demographics | Rating | Rank | Unemployment |
| Canadians | 97.7 /100 | #79 | Exceptional 5.0% |
| Immigrants | Sweden | 97.6 /100 | #80 | Exceptional 5.0% |
| Basques | 97.6 /100 | #81 | Exceptional 5.0% |
| Fijians | 97.6 /100 | #82 | Exceptional 5.0% |
| Hmong | 97.6 /100 | #83 | Exceptional 5.0% |
| Russians | 97.4 /100 | #84 | Exceptional 5.0% |
| Immigrants | Australia | 97.0 /100 | #85 | Exceptional 5.0% |
| Hungarians | 96.9 /100 | #86 | Exceptional 5.0% |
| Immigrants | Moldova | 96.6 /100 | #87 | Exceptional 5.0% |
| Immigrants | Korea | 96.6 /100 | #88 | Exceptional 5.0% |
| Jordanians | 96.4 /100 | #89 | Exceptional 5.0% |
| Immigrants | North Macedonia | 96.3 /100 | #90 | Exceptional 5.0% |
| Immigrants | Sudan | 96.3 /100 | #91 | Exceptional 5.0% |
| Immigrants | South Africa | 96.2 /100 | #92 | Exceptional 5.0% |
| Ukrainians | 96.0 /100 | #93 | Exceptional 5.0% |
Demographics Similar to Immigrants from Africa by Unemployment
In terms of unemployment, the demographic groups most similar to Immigrants from Africa are Comanche (5.5%, a difference of 0.0%), Immigrants from Syria (5.5%, a difference of 0.050%), Panamanian (5.5%, a difference of 0.080%), Hawaiian (5.5%, a difference of 0.13%), and Ottawa (5.5%, a difference of 0.13%).
| Demographics | Rating | Rank | Unemployment |
| Israelis | 8.8 /100 | #224 | Tragic 5.4% |
| South American Indians | 7.8 /100 | #225 | Tragic 5.5% |
| Samoans | 7.1 /100 | #226 | Tragic 5.5% |
| Immigrants | Lebanon | 7.0 /100 | #227 | Tragic 5.5% |
| Guamanians/Chamorros | 6.3 /100 | #228 | Tragic 5.5% |
| Hawaiians | 5.4 /100 | #229 | Tragic 5.5% |
| Ottawa | 5.4 /100 | #230 | Tragic 5.5% |
| Immigrants | Africa | 4.9 /100 | #231 | Tragic 5.5% |
| Comanche | 4.9 /100 | #232 | Tragic 5.5% |
| Immigrants | Syria | 4.8 /100 | #233 | Tragic 5.5% |
| Panamanians | 4.7 /100 | #234 | Tragic 5.5% |
| Immigrants | Panama | 3.4 /100 | #235 | Tragic 5.5% |
| Immigrants | Cambodia | 3.3 /100 | #236 | Tragic 5.5% |
| Moroccans | 3.2 /100 | #237 | Tragic 5.5% |
| Immigrants | Western Asia | 2.8 /100 | #238 | Tragic 5.5% |