Immigrants from Argentina vs Ottawa Unemployment Among Women with Children Under 6 years
COMPARE
Immigrants from Argentina
Ottawa
Unemployment Among Women with Children Under 6 years
Unemployment Among Women with Children Under 6 years Comparison
Immigrants from Argentina
Ottawa
7.5%
UNEMPLOYMENT AMONG WOMEN WITH CHILDREN UNDER 6 YEARS
81.5/ 100
METRIC RATING
142nd/ 347
METRIC RANK
9.9%
UNEMPLOYMENT AMONG WOMEN WITH CHILDREN UNDER 6 YEARS
0.0/ 100
METRIC RATING
327th/ 347
METRIC RANK
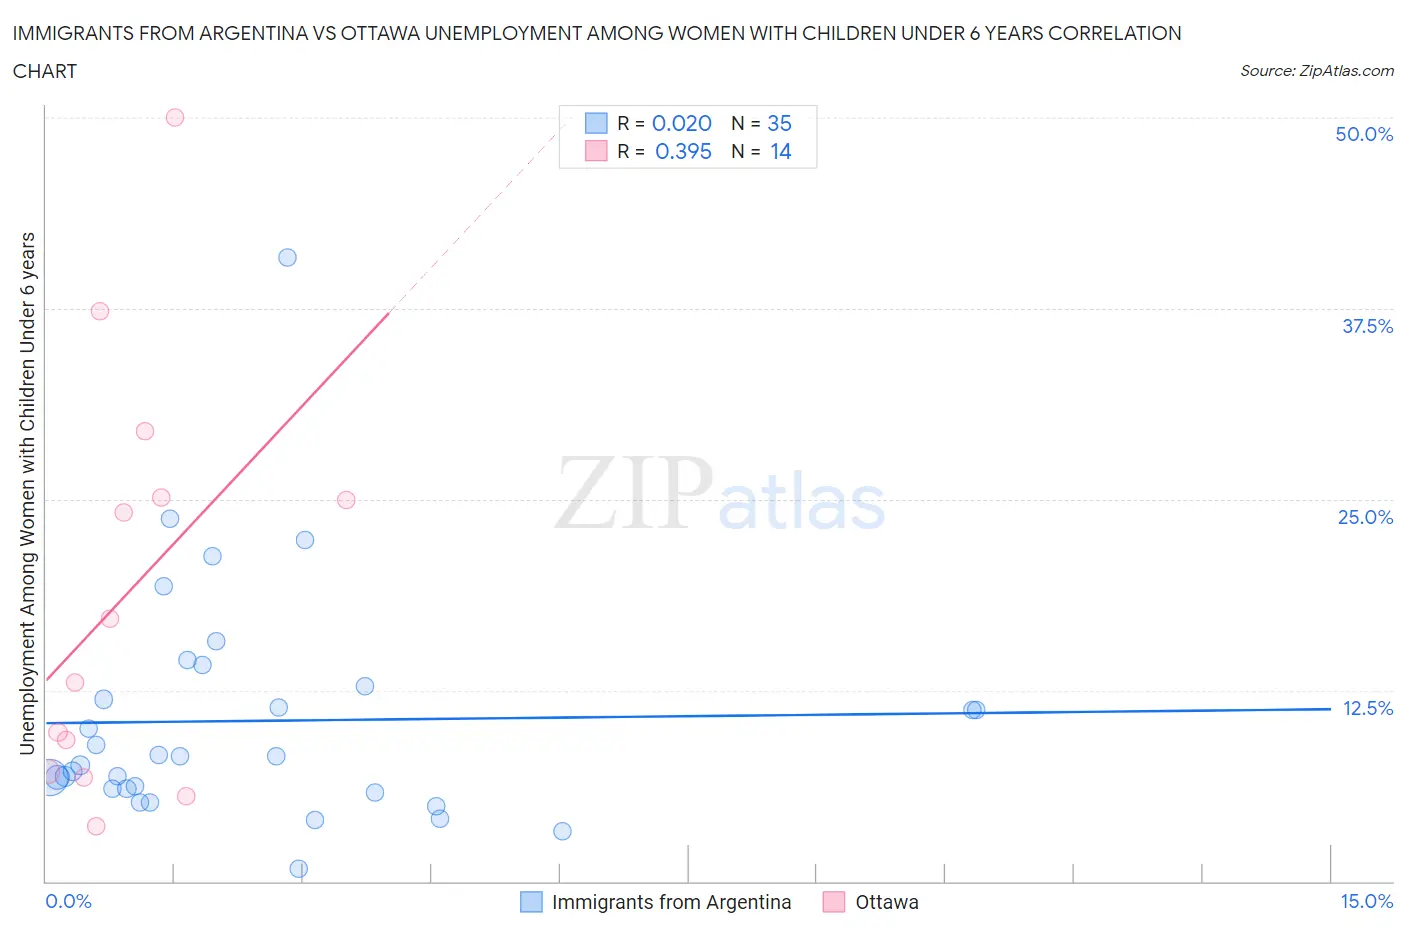
Immigrants from Argentina vs Ottawa Unemployment Among Women with Children Under 6 years Correlation Chart
The statistical analysis conducted on geographies consisting of 215,800,646 people shows no correlation between the proportion of Immigrants from Argentina and unemployment rate among women with children under the age of 6 in the United States with a correlation coefficient (R) of 0.020 and weighted average of 7.5%. Similarly, the statistical analysis conducted on geographies consisting of 44,780,729 people shows a mild positive correlation between the proportion of Ottawa and unemployment rate among women with children under the age of 6 in the United States with a correlation coefficient (R) of 0.395 and weighted average of 9.9%, a difference of 32.4%.
Unemployment Among Women with Children Under 6 years Correlation Summary
| Measurement | Immigrants from Argentina | Ottawa |
| Minimum | 0.80% | 3.6% |
| Maximum | 40.8% | 50.0% |
| Range | 40.0% | 46.4% |
| Mean | 10.5% | 18.8% |
| Median | 8.2% | 15.1% |
| Interquartile 25% (IQ1) | 6.0% | 7.2% |
| Interquartile 75% (IQ3) | 12.8% | 25.1% |
| Interquartile Range (IQR) | 6.7% | 17.9% |
| Standard Deviation (Sample) | 7.6% | 13.7% |
| Standard Deviation (Population) | 7.5% | 13.2% |
Similar Demographics by Unemployment Among Women with Children Under 6 years
Demographics Similar to Immigrants from Argentina by Unemployment Among Women with Children Under 6 years
In terms of unemployment among women with children under 6 years, the demographic groups most similar to Immigrants from Argentina are Korean (7.5%, a difference of 0.020%), Greek (7.4%, a difference of 0.12%), Scandinavian (7.4%, a difference of 0.18%), European (7.5%, a difference of 0.25%), and Immigrants from Jordan (7.5%, a difference of 0.28%).
| Demographics | Rating | Rank | Unemployment Among Women with Children Under 6 years |
| Immigrants | Northern Africa | 85.3 /100 | #135 | Excellent 7.4% |
| Immigrants | Morocco | 84.9 /100 | #136 | Excellent 7.4% |
| Immigrants | Cambodia | 84.6 /100 | #137 | Excellent 7.4% |
| Immigrants | Norway | 84.1 /100 | #138 | Excellent 7.4% |
| Immigrants | Colombia | 83.9 /100 | #139 | Excellent 7.4% |
| Scandinavians | 83.0 /100 | #140 | Excellent 7.4% |
| Greeks | 82.6 /100 | #141 | Excellent 7.4% |
| Immigrants | Argentina | 81.5 /100 | #142 | Excellent 7.5% |
| Koreans | 81.3 /100 | #143 | Excellent 7.5% |
| Europeans | 79.1 /100 | #144 | Good 7.5% |
| Immigrants | Jordan | 78.9 /100 | #145 | Good 7.5% |
| Japanese | 78.9 /100 | #146 | Good 7.5% |
| Immigrants | Oceania | 78.4 /100 | #147 | Good 7.5% |
| Immigrants | Brazil | 77.3 /100 | #148 | Good 7.5% |
| Colombians | 76.1 /100 | #149 | Good 7.5% |
Demographics Similar to Ottawa by Unemployment Among Women with Children Under 6 years
In terms of unemployment among women with children under 6 years, the demographic groups most similar to Ottawa are Delaware (9.8%, a difference of 0.80%), Choctaw (9.8%, a difference of 0.83%), Paiute (9.7%, a difference of 1.8%), Immigrants from Bahamas (9.6%, a difference of 2.5%), and Alaska Native (9.6%, a difference of 2.7%).
| Demographics | Rating | Rank | Unemployment Among Women with Children Under 6 years |
| Potawatomi | 0.0 /100 | #320 | Tragic 9.6% |
| Central American Indians | 0.0 /100 | #321 | Tragic 9.6% |
| Alaska Natives | 0.0 /100 | #322 | Tragic 9.6% |
| Immigrants | Bahamas | 0.0 /100 | #323 | Tragic 9.6% |
| Paiute | 0.0 /100 | #324 | Tragic 9.7% |
| Choctaw | 0.0 /100 | #325 | Tragic 9.8% |
| Delaware | 0.0 /100 | #326 | Tragic 9.8% |
| Ottawa | 0.0 /100 | #327 | Tragic 9.9% |
| Tohono O'odham | 0.0 /100 | #328 | Tragic 10.2% |
| Blacks/African Americans | 0.0 /100 | #329 | Tragic 10.3% |
| Pennsylvania Germans | 0.0 /100 | #330 | Tragic 10.8% |
| Colville | 0.0 /100 | #331 | Tragic 11.2% |
| Sioux | 0.0 /100 | #332 | Tragic 11.5% |
| Natives/Alaskans | 0.0 /100 | #333 | Tragic 11.5% |
| Apache | 0.0 /100 | #334 | Tragic 12.3% |