Immigrants from Argentina vs Immigrants from Sudan Unemployment Among Women with Children Under 6 years
COMPARE
Immigrants from Argentina
Immigrants from Sudan
Unemployment Among Women with Children Under 6 years
Unemployment Among Women with Children Under 6 years Comparison
Immigrants from Argentina
Immigrants from Sudan
7.5%
UNEMPLOYMENT AMONG WOMEN WITH CHILDREN UNDER 6 YEARS
81.5/ 100
METRIC RATING
142nd/ 347
METRIC RANK
8.0%
UNEMPLOYMENT AMONG WOMEN WITH CHILDREN UNDER 6 YEARS
6.0/ 100
METRIC RATING
228th/ 347
METRIC RANK
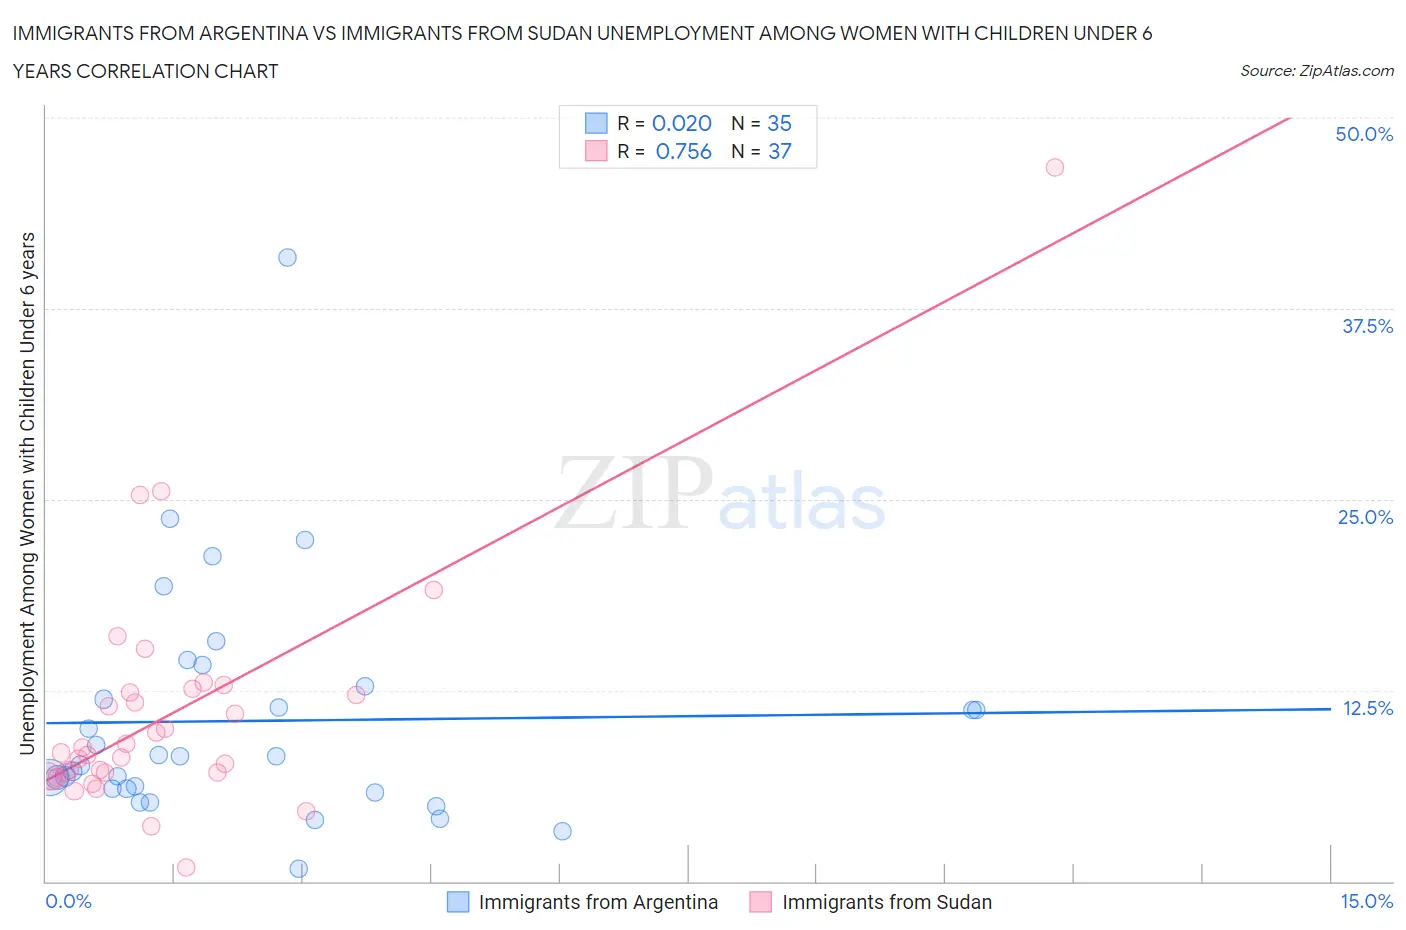
Immigrants from Argentina vs Immigrants from Sudan Unemployment Among Women with Children Under 6 years Correlation Chart
The statistical analysis conducted on geographies consisting of 215,800,646 people shows no correlation between the proportion of Immigrants from Argentina and unemployment rate among women with children under the age of 6 in the United States with a correlation coefficient (R) of 0.020 and weighted average of 7.5%. Similarly, the statistical analysis conducted on geographies consisting of 108,811,214 people shows a strong positive correlation between the proportion of Immigrants from Sudan and unemployment rate among women with children under the age of 6 in the United States with a correlation coefficient (R) of 0.756 and weighted average of 8.0%, a difference of 7.2%.
Unemployment Among Women with Children Under 6 years Correlation Summary
| Measurement | Immigrants from Argentina | Immigrants from Sudan |
| Minimum | 0.80% | 0.90% |
| Maximum | 40.8% | 46.7% |
| Range | 40.0% | 45.8% |
| Mean | 10.5% | 11.0% |
| Median | 8.2% | 8.4% |
| Interquartile 25% (IQ1) | 6.0% | 7.0% |
| Interquartile 75% (IQ3) | 12.8% | 12.5% |
| Interquartile Range (IQR) | 6.7% | 5.5% |
| Standard Deviation (Sample) | 7.6% | 7.9% |
| Standard Deviation (Population) | 7.5% | 7.8% |
Similar Demographics by Unemployment Among Women with Children Under 6 years
Demographics Similar to Immigrants from Argentina by Unemployment Among Women with Children Under 6 years
In terms of unemployment among women with children under 6 years, the demographic groups most similar to Immigrants from Argentina are Korean (7.5%, a difference of 0.020%), Greek (7.4%, a difference of 0.12%), Scandinavian (7.4%, a difference of 0.18%), European (7.5%, a difference of 0.25%), and Immigrants from Jordan (7.5%, a difference of 0.28%).
| Demographics | Rating | Rank | Unemployment Among Women with Children Under 6 years |
| Immigrants | Northern Africa | 85.3 /100 | #135 | Excellent 7.4% |
| Immigrants | Morocco | 84.9 /100 | #136 | Excellent 7.4% |
| Immigrants | Cambodia | 84.6 /100 | #137 | Excellent 7.4% |
| Immigrants | Norway | 84.1 /100 | #138 | Excellent 7.4% |
| Immigrants | Colombia | 83.9 /100 | #139 | Excellent 7.4% |
| Scandinavians | 83.0 /100 | #140 | Excellent 7.4% |
| Greeks | 82.6 /100 | #141 | Excellent 7.4% |
| Immigrants | Argentina | 81.5 /100 | #142 | Excellent 7.5% |
| Koreans | 81.3 /100 | #143 | Excellent 7.5% |
| Europeans | 79.1 /100 | #144 | Good 7.5% |
| Immigrants | Jordan | 78.9 /100 | #145 | Good 7.5% |
| Japanese | 78.9 /100 | #146 | Good 7.5% |
| Immigrants | Oceania | 78.4 /100 | #147 | Good 7.5% |
| Immigrants | Brazil | 77.3 /100 | #148 | Good 7.5% |
| Colombians | 76.1 /100 | #149 | Good 7.5% |
Demographics Similar to Immigrants from Sudan by Unemployment Among Women with Children Under 6 years
In terms of unemployment among women with children under 6 years, the demographic groups most similar to Immigrants from Sudan are Portuguese (8.0%, a difference of 0.030%), Senegalese (8.0%, a difference of 0.040%), Salvadoran (8.0%, a difference of 0.15%), Finnish (8.0%, a difference of 0.22%), and Trinidadian and Tobagonian (8.0%, a difference of 0.22%).
| Demographics | Rating | Rank | Unemployment Among Women with Children Under 6 years |
| Immigrants | Germany | 8.5 /100 | #221 | Tragic 7.9% |
| Samoans | 8.4 /100 | #222 | Tragic 7.9% |
| Carpatho Rusyns | 7.8 /100 | #223 | Tragic 8.0% |
| English | 7.2 /100 | #224 | Tragic 8.0% |
| Germans | 7.0 /100 | #225 | Tragic 8.0% |
| Senegalese | 6.2 /100 | #226 | Tragic 8.0% |
| Portuguese | 6.2 /100 | #227 | Tragic 8.0% |
| Immigrants | Sudan | 6.0 /100 | #228 | Tragic 8.0% |
| Salvadorans | 5.5 /100 | #229 | Tragic 8.0% |
| Finns | 5.3 /100 | #230 | Tragic 8.0% |
| Trinidadians and Tobagonians | 5.3 /100 | #231 | Tragic 8.0% |
| Welsh | 5.0 /100 | #232 | Tragic 8.0% |
| Immigrants | Trinidad and Tobago | 4.8 /100 | #233 | Tragic 8.0% |
| Kiowa | 4.4 /100 | #234 | Tragic 8.0% |
| Comanche | 4.3 /100 | #235 | Tragic 8.0% |