Immigrants from Afghanistan vs Northern European Unemployment
COMPARE
Immigrants from Afghanistan
Northern European
Unemployment
Unemployment Comparison
Immigrants from Afghanistan
Northern Europeans
5.3%
UNEMPLOYMENT
28.6/ 100
METRIC RATING
199th/ 347
METRIC RANK
4.8%
UNEMPLOYMENT
99.7/ 100
METRIC RATING
40th/ 347
METRIC RANK
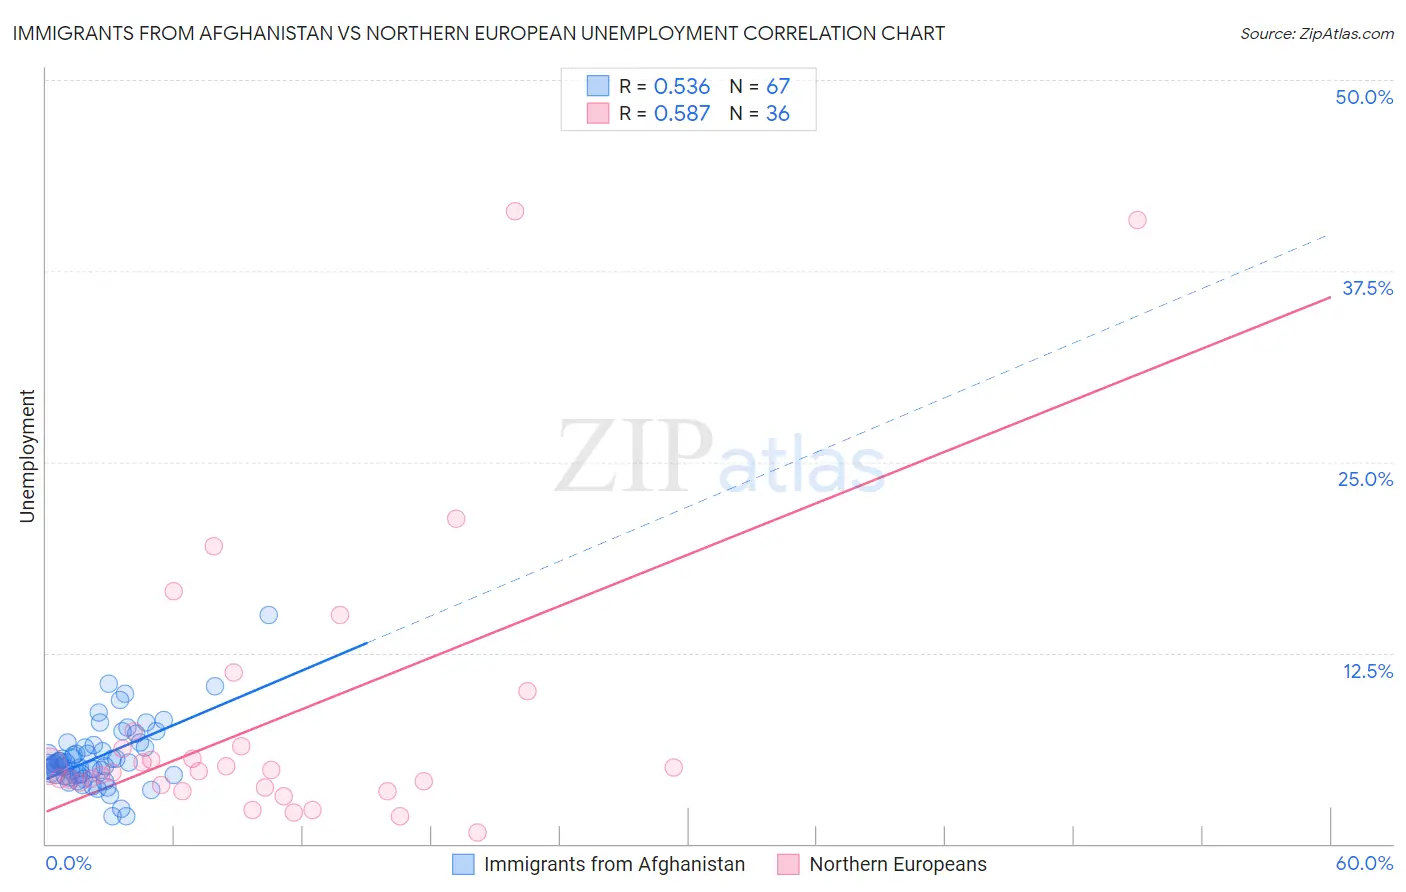
Immigrants from Afghanistan vs Northern European Unemployment Correlation Chart
The statistical analysis conducted on geographies consisting of 147,628,423 people shows a substantial positive correlation between the proportion of Immigrants from Afghanistan and unemployment in the United States with a correlation coefficient (R) of 0.536 and weighted average of 5.3%. Similarly, the statistical analysis conducted on geographies consisting of 405,473,873 people shows a substantial positive correlation between the proportion of Northern Europeans and unemployment in the United States with a correlation coefficient (R) of 0.587 and weighted average of 4.8%, a difference of 11.1%.
Unemployment Correlation Summary
| Measurement | Immigrants from Afghanistan | Northern European |
| Minimum | 1.8% | 0.70% |
| Maximum | 15.0% | 41.4% |
| Range | 13.2% | 40.7% |
| Mean | 5.6% | 8.1% |
| Median | 5.2% | 4.8% |
| Interquartile 25% (IQ1) | 4.5% | 3.7% |
| Interquartile 75% (IQ3) | 6.3% | 6.9% |
| Interquartile Range (IQR) | 1.8% | 3.1% |
| Standard Deviation (Sample) | 2.1% | 9.4% |
| Standard Deviation (Population) | 2.1% | 9.3% |
Similar Demographics by Unemployment
Demographics Similar to Immigrants from Afghanistan by Unemployment
In terms of unemployment, the demographic groups most similar to Immigrants from Afghanistan are Immigrants from Israel (5.3%, a difference of 0.0%), Immigrants from Uruguay (5.3%, a difference of 0.090%), Korean (5.3%, a difference of 0.090%), Peruvian (5.3%, a difference of 0.10%), and Immigrants from South Eastern Asia (5.3%, a difference of 0.12%).
| Demographics | Rating | Rank | Unemployment |
| South Americans | 33.9 /100 | #192 | Fair 5.3% |
| Immigrants | Somalia | 33.8 /100 | #193 | Fair 5.3% |
| Immigrants | Laos | 30.9 /100 | #194 | Fair 5.3% |
| Immigrants | Southern Europe | 30.9 /100 | #195 | Fair 5.3% |
| Peruvians | 29.9 /100 | #196 | Fair 5.3% |
| Immigrants | Uruguay | 29.8 /100 | #197 | Fair 5.3% |
| Immigrants | Israel | 28.6 /100 | #198 | Fair 5.3% |
| Immigrants | Afghanistan | 28.6 /100 | #199 | Fair 5.3% |
| Koreans | 27.4 /100 | #200 | Fair 5.3% |
| Immigrants | South Eastern Asia | 27.0 /100 | #201 | Fair 5.3% |
| Cherokee | 25.5 /100 | #202 | Fair 5.3% |
| Immigrants | Micronesia | 25.2 /100 | #203 | Fair 5.3% |
| Immigrants | Ukraine | 24.9 /100 | #204 | Fair 5.3% |
| Native Hawaiians | 24.1 /100 | #205 | Fair 5.3% |
| Immigrants | Peru | 22.7 /100 | #206 | Fair 5.4% |
Demographics Similar to Northern Europeans by Unemployment
In terms of unemployment, the demographic groups most similar to Northern Europeans are Lithuanian (4.8%, a difference of 0.020%), Immigrants from Bosnia and Herzegovina (4.8%, a difference of 0.030%), Bolivian (4.8%, a difference of 0.16%), Czechoslovakian (4.8%, a difference of 0.35%), and Tongan (4.8%, a difference of 0.42%).
| Demographics | Rating | Rank | Unemployment |
| Sudanese | 99.8 /100 | #33 | Exceptional 4.8% |
| Immigrants | Bolivia | 99.8 /100 | #34 | Exceptional 4.8% |
| Scotch-Irish | 99.8 /100 | #35 | Exceptional 4.8% |
| Tongans | 99.7 /100 | #36 | Exceptional 4.8% |
| Czechoslovakians | 99.7 /100 | #37 | Exceptional 4.8% |
| Bolivians | 99.7 /100 | #38 | Exceptional 4.8% |
| Lithuanians | 99.7 /100 | #39 | Exceptional 4.8% |
| Northern Europeans | 99.7 /100 | #40 | Exceptional 4.8% |
| Immigrants | Bosnia and Herzegovina | 99.7 /100 | #41 | Exceptional 4.8% |
| Filipinos | 99.5 /100 | #42 | Exceptional 4.8% |
| Yugoslavians | 99.5 /100 | #43 | Exceptional 4.8% |
| Austrians | 99.5 /100 | #44 | Exceptional 4.8% |
| French | 99.5 /100 | #45 | Exceptional 4.8% |
| Immigrants | Nepal | 99.4 /100 | #46 | Exceptional 4.8% |
| Immigrants | Taiwan | 99.4 /100 | #47 | Exceptional 4.8% |