Icelander vs Immigrants from Philippines Unemployment Among Women with Children Ages 6 to 17 years
COMPARE
Icelander
Immigrants from Philippines
Unemployment Among Women with Children Ages 6 to 17 years
Unemployment Among Women with Children Ages 6 to 17 years Comparison
Icelanders
Immigrants from Philippines
8.1%
UNEMPLOYMENT AMONG WOMEN WITH CHILDREN AGES 6 TO 17 YEARS
100.0/ 100
METRIC RATING
46th/ 347
METRIC RANK
8.2%
UNEMPLOYMENT AMONG WOMEN WITH CHILDREN AGES 6 TO 17 YEARS
100.0/ 100
METRIC RATING
59th/ 347
METRIC RANK
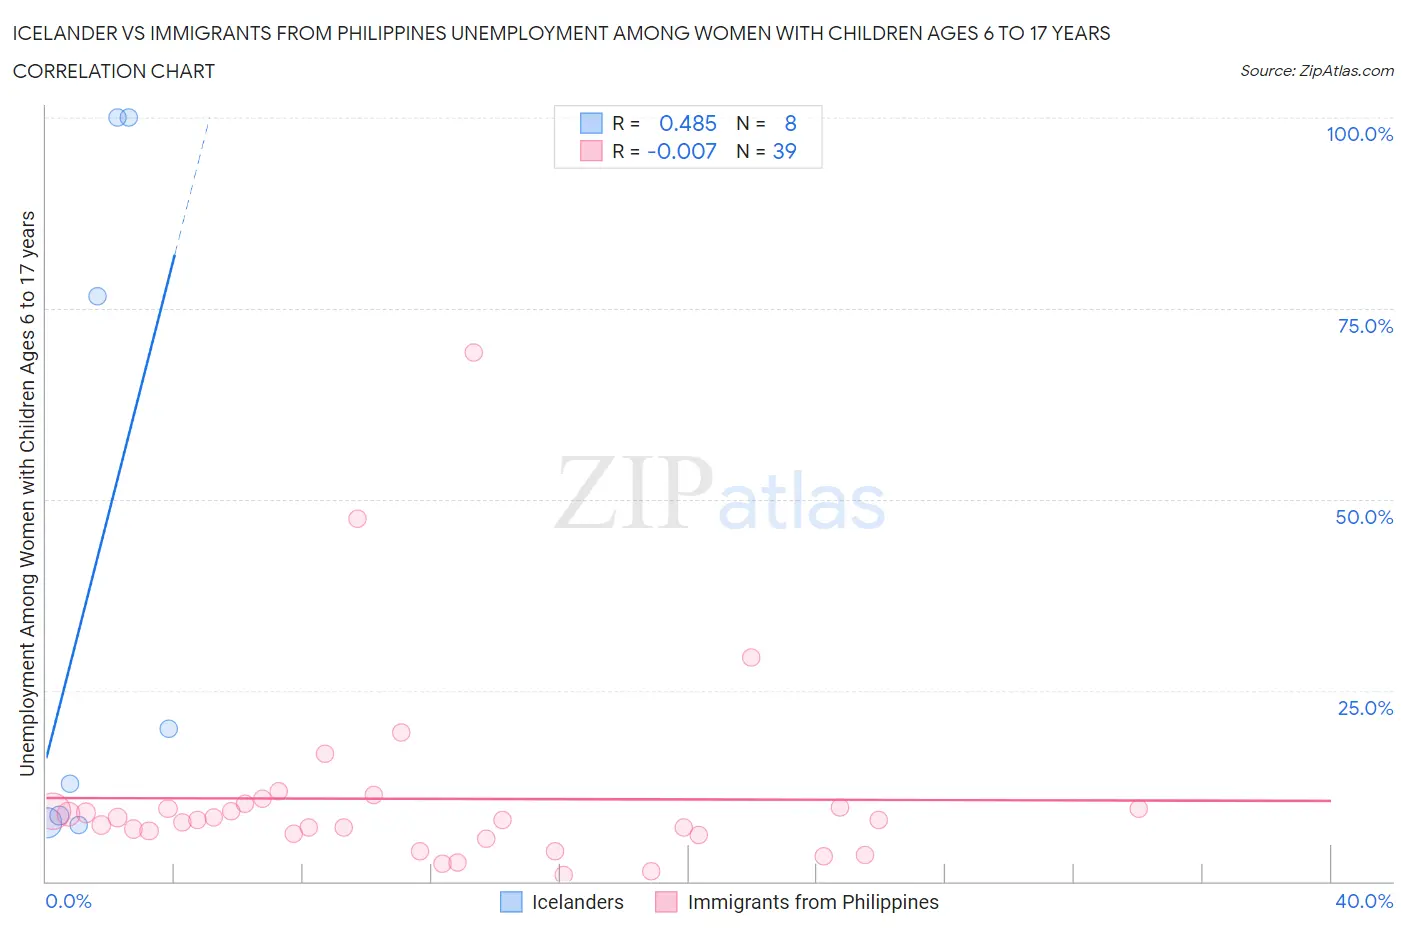
Icelander vs Immigrants from Philippines Unemployment Among Women with Children Ages 6 to 17 years Correlation Chart
The statistical analysis conducted on geographies consisting of 127,654,017 people shows a moderate positive correlation between the proportion of Icelanders and unemployment rate among women with children between the ages 6 and 17 in the United States with a correlation coefficient (R) of 0.485 and weighted average of 8.1%. Similarly, the statistical analysis conducted on geographies consisting of 325,343,715 people shows no correlation between the proportion of Immigrants from Philippines and unemployment rate among women with children between the ages 6 and 17 in the United States with a correlation coefficient (R) of -0.007 and weighted average of 8.2%, a difference of 1.5%.
Unemployment Among Women with Children Ages 6 to 17 years Correlation Summary
| Measurement | Icelander | Immigrants from Philippines |
| Minimum | 7.3% | 0.80% |
| Maximum | 100.0% | 69.3% |
| Range | 92.7% | 68.5% |
| Mean | 41.6% | 10.8% |
| Median | 16.4% | 8.0% |
| Interquartile 25% (IQ1) | 8.1% | 6.1% |
| Interquartile 75% (IQ3) | 88.3% | 9.7% |
| Interquartile Range (IQR) | 80.2% | 3.6% |
| Standard Deviation (Sample) | 42.7% | 12.5% |
| Standard Deviation (Population) | 39.9% | 12.4% |
Demographics Similar to Icelanders and Immigrants from Philippines by Unemployment Among Women with Children Ages 6 to 17 years
In terms of unemployment among women with children ages 6 to 17 years, the demographic groups most similar to Icelanders are Immigrants from Bulgaria (8.1%, a difference of 0.020%), Immigrants from Switzerland (8.1%, a difference of 0.040%), Immigrants from Sweden (8.1%, a difference of 0.060%), Bhutanese (8.1%, a difference of 0.10%), and Immigrants from Asia (8.1%, a difference of 0.17%). Similarly, the demographic groups most similar to Immigrants from Philippines are Basque (8.2%, a difference of 0.0%), Immigrants from Malaysia (8.2%, a difference of 0.060%), Korean (8.2%, a difference of 0.19%), Spanish American Indian (8.2%, a difference of 0.22%), and Immigrants from Laos (8.2%, a difference of 0.26%).
| Demographics | Rating | Rank | Unemployment Among Women with Children Ages 6 to 17 years |
| Immigrants | Somalia | 100.0 /100 | #42 | Exceptional 8.0% |
| Bhutanese | 100.0 /100 | #43 | Exceptional 8.1% |
| Immigrants | Sweden | 100.0 /100 | #44 | Exceptional 8.1% |
| Immigrants | Bulgaria | 100.0 /100 | #45 | Exceptional 8.1% |
| Icelanders | 100.0 /100 | #46 | Exceptional 8.1% |
| Immigrants | Switzerland | 100.0 /100 | #47 | Exceptional 8.1% |
| Immigrants | Asia | 100.0 /100 | #48 | Exceptional 8.1% |
| Immigrants | Oceania | 100.0 /100 | #49 | Exceptional 8.1% |
| Hawaiians | 100.0 /100 | #50 | Exceptional 8.1% |
| Immigrants | Sudan | 100.0 /100 | #51 | Exceptional 8.1% |
| Immigrants | Iraq | 100.0 /100 | #52 | Exceptional 8.1% |
| Danes | 100.0 /100 | #53 | Exceptional 8.1% |
| Immigrants | Armenia | 100.0 /100 | #54 | Exceptional 8.2% |
| Immigrants | Japan | 100.0 /100 | #55 | Exceptional 8.2% |
| Immigrants | Bosnia and Herzegovina | 100.0 /100 | #56 | Exceptional 8.2% |
| Immigrants | Laos | 100.0 /100 | #57 | Exceptional 8.2% |
| Immigrants | Malaysia | 100.0 /100 | #58 | Exceptional 8.2% |
| Immigrants | Philippines | 100.0 /100 | #59 | Exceptional 8.2% |
| Basques | 100.0 /100 | #60 | Exceptional 8.2% |
| Koreans | 100.0 /100 | #61 | Exceptional 8.2% |
| Spanish American Indians | 100.0 /100 | #62 | Exceptional 8.2% |