Icelander vs Immigrants from Bahamas Unemployment Among Women with Children Ages 6 to 17 years
COMPARE
Icelander
Immigrants from Bahamas
Unemployment Among Women with Children Ages 6 to 17 years
Unemployment Among Women with Children Ages 6 to 17 years Comparison
Icelanders
Immigrants from Bahamas
8.1%
UNEMPLOYMENT AMONG WOMEN WITH CHILDREN AGES 6 TO 17 YEARS
100.0/ 100
METRIC RATING
46th/ 347
METRIC RANK
10.1%
UNEMPLOYMENT AMONG WOMEN WITH CHILDREN AGES 6 TO 17 YEARS
0.0/ 100
METRIC RATING
301st/ 347
METRIC RANK
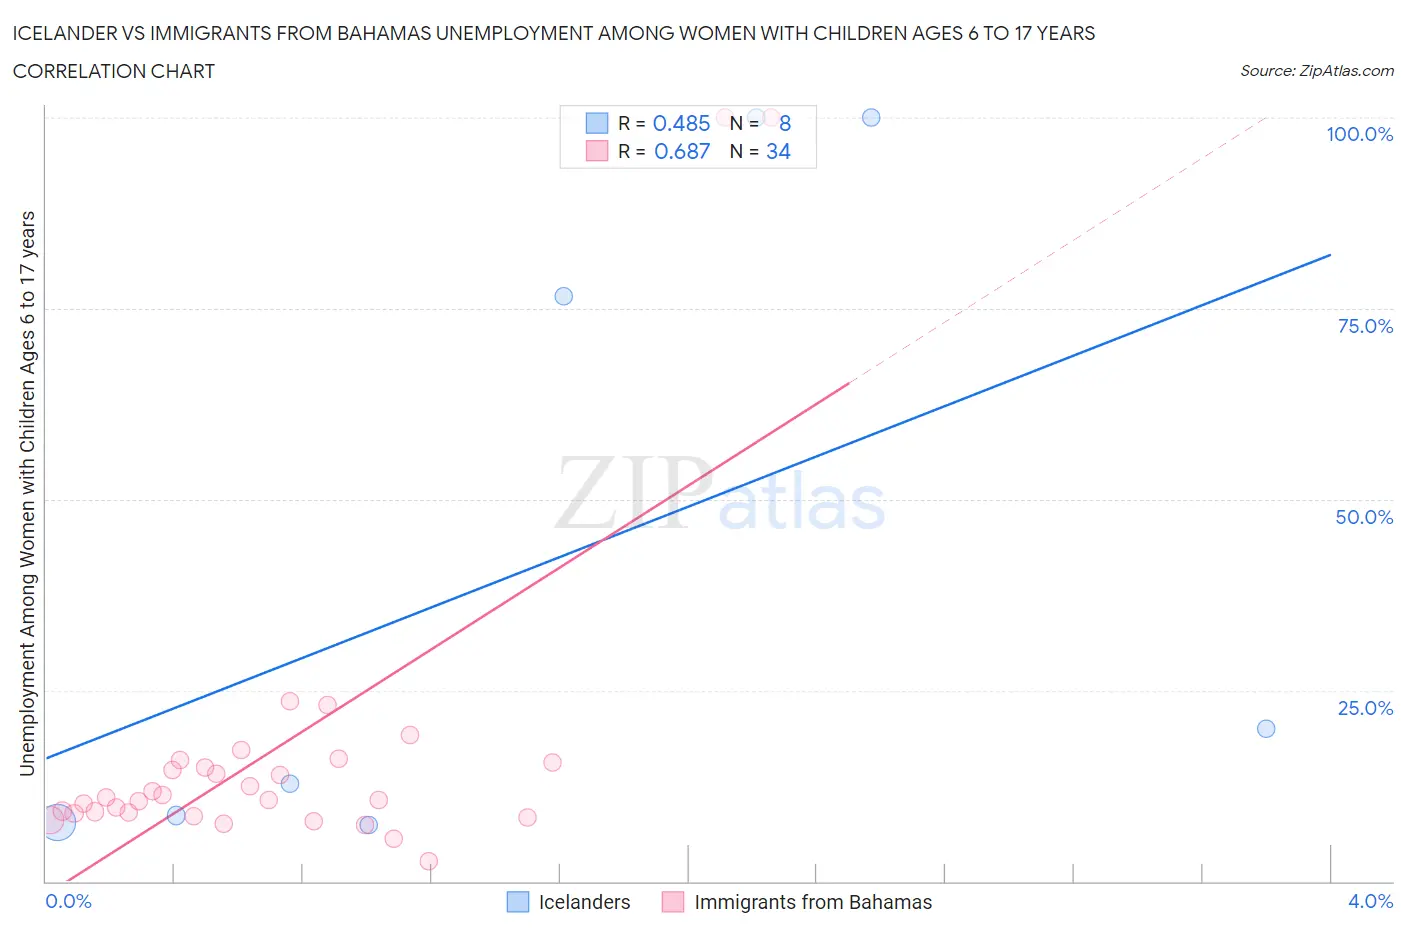
Icelander vs Immigrants from Bahamas Unemployment Among Women with Children Ages 6 to 17 years Correlation Chart
The statistical analysis conducted on geographies consisting of 127,654,017 people shows a moderate positive correlation between the proportion of Icelanders and unemployment rate among women with children between the ages 6 and 17 in the United States with a correlation coefficient (R) of 0.485 and weighted average of 8.1%. Similarly, the statistical analysis conducted on geographies consisting of 91,256,917 people shows a significant positive correlation between the proportion of Immigrants from Bahamas and unemployment rate among women with children between the ages 6 and 17 in the United States with a correlation coefficient (R) of 0.687 and weighted average of 10.1%, a difference of 25.4%.
Unemployment Among Women with Children Ages 6 to 17 years Correlation Summary
| Measurement | Icelander | Immigrants from Bahamas |
| Minimum | 7.3% | 2.7% |
| Maximum | 100.0% | 100.0% |
| Range | 92.7% | 97.3% |
| Mean | 41.6% | 17.0% |
| Median | 16.4% | 10.8% |
| Interquartile 25% (IQ1) | 8.1% | 8.9% |
| Interquartile 75% (IQ3) | 88.3% | 15.5% |
| Interquartile Range (IQR) | 80.2% | 6.6% |
| Standard Deviation (Sample) | 42.7% | 21.5% |
| Standard Deviation (Population) | 39.9% | 21.2% |
Similar Demographics by Unemployment Among Women with Children Ages 6 to 17 years
Demographics Similar to Icelanders by Unemployment Among Women with Children Ages 6 to 17 years
In terms of unemployment among women with children ages 6 to 17 years, the demographic groups most similar to Icelanders are Immigrants from Bulgaria (8.1%, a difference of 0.020%), Immigrants from Switzerland (8.1%, a difference of 0.040%), Immigrants from Sweden (8.1%, a difference of 0.060%), Bhutanese (8.1%, a difference of 0.10%), and Immigrants from Asia (8.1%, a difference of 0.17%).
| Demographics | Rating | Rank | Unemployment Among Women with Children Ages 6 to 17 years |
| Somalis | 100.0 /100 | #39 | Exceptional 8.0% |
| Immigrants | Zimbabwe | 100.0 /100 | #40 | Exceptional 8.0% |
| Iranians | 100.0 /100 | #41 | Exceptional 8.0% |
| Immigrants | Somalia | 100.0 /100 | #42 | Exceptional 8.0% |
| Bhutanese | 100.0 /100 | #43 | Exceptional 8.1% |
| Immigrants | Sweden | 100.0 /100 | #44 | Exceptional 8.1% |
| Immigrants | Bulgaria | 100.0 /100 | #45 | Exceptional 8.1% |
| Icelanders | 100.0 /100 | #46 | Exceptional 8.1% |
| Immigrants | Switzerland | 100.0 /100 | #47 | Exceptional 8.1% |
| Immigrants | Asia | 100.0 /100 | #48 | Exceptional 8.1% |
| Immigrants | Oceania | 100.0 /100 | #49 | Exceptional 8.1% |
| Hawaiians | 100.0 /100 | #50 | Exceptional 8.1% |
| Immigrants | Sudan | 100.0 /100 | #51 | Exceptional 8.1% |
| Immigrants | Iraq | 100.0 /100 | #52 | Exceptional 8.1% |
| Danes | 100.0 /100 | #53 | Exceptional 8.1% |
Demographics Similar to Immigrants from Bahamas by Unemployment Among Women with Children Ages 6 to 17 years
In terms of unemployment among women with children ages 6 to 17 years, the demographic groups most similar to Immigrants from Bahamas are Nigerian (10.1%, a difference of 0.15%), Immigrants from Honduras (10.1%, a difference of 0.18%), Immigrants from Haiti (10.1%, a difference of 0.20%), Venezuelan (10.2%, a difference of 0.45%), and Immigrants from Caribbean (10.1%, a difference of 0.50%).
| Demographics | Rating | Rank | Unemployment Among Women with Children Ages 6 to 17 years |
| Ecuadorians | 0.0 /100 | #294 | Tragic 10.0% |
| Cherokee | 0.0 /100 | #295 | Tragic 10.0% |
| Immigrants | Western Africa | 0.0 /100 | #296 | Tragic 10.1% |
| Immigrants | Caribbean | 0.0 /100 | #297 | Tragic 10.1% |
| Immigrants | Haiti | 0.0 /100 | #298 | Tragic 10.1% |
| Immigrants | Honduras | 0.0 /100 | #299 | Tragic 10.1% |
| Nigerians | 0.0 /100 | #300 | Tragic 10.1% |
| Immigrants | Bahamas | 0.0 /100 | #301 | Tragic 10.1% |
| Venezuelans | 0.0 /100 | #302 | Tragic 10.2% |
| Immigrants | Ecuador | 0.0 /100 | #303 | Tragic 10.2% |
| Immigrants | Venezuela | 0.0 /100 | #304 | Tragic 10.2% |
| Immigrants | Nigeria | 0.0 /100 | #305 | Tragic 10.2% |
| Paraguayans | 0.0 /100 | #306 | Tragic 10.2% |
| Immigrants | Senegal | 0.0 /100 | #307 | Tragic 10.2% |
| Dutch West Indians | 0.0 /100 | #308 | Tragic 10.2% |