Immigrants from Cabo Verde vs Immigrants from Philippines Unemployment Among Women with Children Ages 6 to 17 years
COMPARE
Immigrants from Cabo Verde
Immigrants from Philippines
Unemployment Among Women with Children Ages 6 to 17 years
Unemployment Among Women with Children Ages 6 to 17 years Comparison
Immigrants from Cabo Verde
Immigrants from Philippines
10.4%
UNEMPLOYMENT AMONG WOMEN WITH CHILDREN AGES 6 TO 17 YEARS
0.0/ 100
METRIC RATING
314th/ 347
METRIC RANK
8.2%
UNEMPLOYMENT AMONG WOMEN WITH CHILDREN AGES 6 TO 17 YEARS
100.0/ 100
METRIC RATING
59th/ 347
METRIC RANK
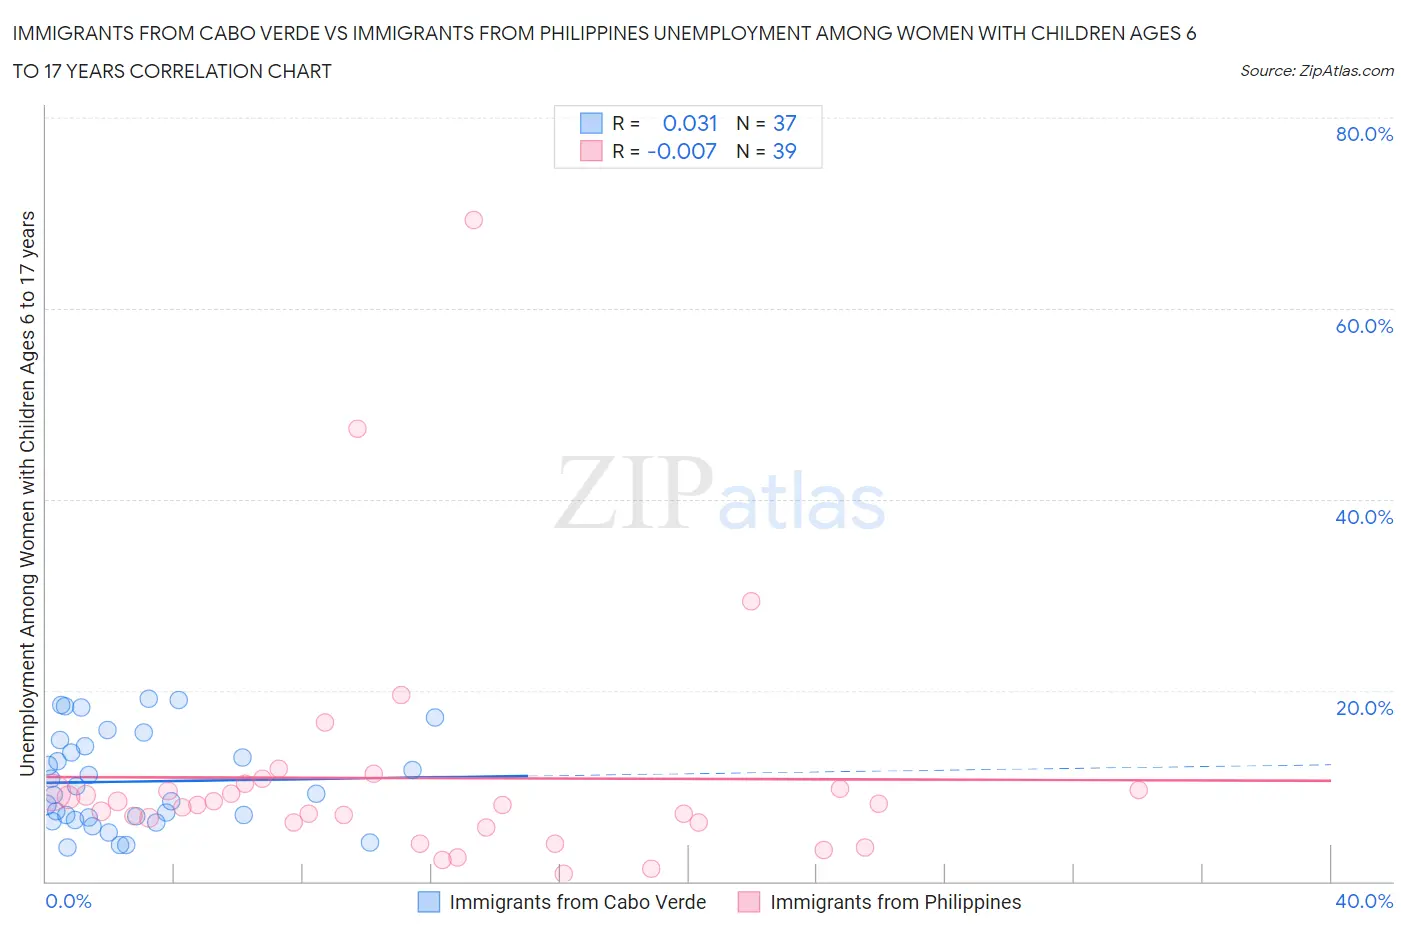
Immigrants from Cabo Verde vs Immigrants from Philippines Unemployment Among Women with Children Ages 6 to 17 years Correlation Chart
The statistical analysis conducted on geographies consisting of 33,958,446 people shows no correlation between the proportion of Immigrants from Cabo Verde and unemployment rate among women with children between the ages 6 and 17 in the United States with a correlation coefficient (R) of 0.031 and weighted average of 10.4%. Similarly, the statistical analysis conducted on geographies consisting of 325,343,715 people shows no correlation between the proportion of Immigrants from Philippines and unemployment rate among women with children between the ages 6 and 17 in the United States with a correlation coefficient (R) of -0.007 and weighted average of 8.2%, a difference of 27.3%.
Unemployment Among Women with Children Ages 6 to 17 years Correlation Summary
| Measurement | Immigrants from Cabo Verde | Immigrants from Philippines |
| Minimum | 3.5% | 0.80% |
| Maximum | 19.1% | 69.3% |
| Range | 15.6% | 68.5% |
| Mean | 10.4% | 10.8% |
| Median | 9.1% | 8.0% |
| Interquartile 25% (IQ1) | 6.6% | 6.1% |
| Interquartile 75% (IQ3) | 14.5% | 9.7% |
| Interquartile Range (IQR) | 7.9% | 3.6% |
| Standard Deviation (Sample) | 4.9% | 12.5% |
| Standard Deviation (Population) | 4.8% | 12.4% |
Similar Demographics by Unemployment Among Women with Children Ages 6 to 17 years
Demographics Similar to Immigrants from Cabo Verde by Unemployment Among Women with Children Ages 6 to 17 years
In terms of unemployment among women with children ages 6 to 17 years, the demographic groups most similar to Immigrants from Cabo Verde are Bahamian (10.4%, a difference of 0.030%), American (10.4%, a difference of 0.050%), African (10.4%, a difference of 0.23%), Immigrants from Dominica (10.5%, a difference of 0.78%), and Bermudan (10.5%, a difference of 0.89%).
| Demographics | Rating | Rank | Unemployment Among Women with Children Ages 6 to 17 years |
| Immigrants | Senegal | 0.0 /100 | #307 | Tragic 10.2% |
| Dutch West Indians | 0.0 /100 | #308 | Tragic 10.2% |
| French Canadians | 0.0 /100 | #309 | Tragic 10.3% |
| Alaska Natives | 0.0 /100 | #310 | Tragic 10.3% |
| Immigrants | Liberia | 0.0 /100 | #311 | Tragic 10.3% |
| Africans | 0.0 /100 | #312 | Tragic 10.4% |
| Americans | 0.0 /100 | #313 | Tragic 10.4% |
| Immigrants | Cabo Verde | 0.0 /100 | #314 | Tragic 10.4% |
| Bahamians | 0.0 /100 | #315 | Tragic 10.4% |
| Immigrants | Dominica | 0.0 /100 | #316 | Tragic 10.5% |
| Bermudans | 0.0 /100 | #317 | Tragic 10.5% |
| Delaware | 0.0 /100 | #318 | Tragic 10.5% |
| Immigrants | Uganda | 0.0 /100 | #319 | Tragic 10.7% |
| Apache | 0.0 /100 | #320 | Tragic 10.7% |
| Tohono O'odham | 0.0 /100 | #321 | Tragic 10.7% |
Demographics Similar to Immigrants from Philippines by Unemployment Among Women with Children Ages 6 to 17 years
In terms of unemployment among women with children ages 6 to 17 years, the demographic groups most similar to Immigrants from Philippines are Basque (8.2%, a difference of 0.0%), Immigrants from Malaysia (8.2%, a difference of 0.060%), Korean (8.2%, a difference of 0.19%), Spanish American Indian (8.2%, a difference of 0.22%), and Immigrants from Laos (8.2%, a difference of 0.26%).
| Demographics | Rating | Rank | Unemployment Among Women with Children Ages 6 to 17 years |
| Immigrants | Iraq | 100.0 /100 | #52 | Exceptional 8.1% |
| Danes | 100.0 /100 | #53 | Exceptional 8.1% |
| Immigrants | Armenia | 100.0 /100 | #54 | Exceptional 8.2% |
| Immigrants | Japan | 100.0 /100 | #55 | Exceptional 8.2% |
| Immigrants | Bosnia and Herzegovina | 100.0 /100 | #56 | Exceptional 8.2% |
| Immigrants | Laos | 100.0 /100 | #57 | Exceptional 8.2% |
| Immigrants | Malaysia | 100.0 /100 | #58 | Exceptional 8.2% |
| Immigrants | Philippines | 100.0 /100 | #59 | Exceptional 8.2% |
| Basques | 100.0 /100 | #60 | Exceptional 8.2% |
| Koreans | 100.0 /100 | #61 | Exceptional 8.2% |
| Spanish American Indians | 100.0 /100 | #62 | Exceptional 8.2% |
| Immigrants | South Eastern Asia | 99.9 /100 | #63 | Exceptional 8.2% |
| Immigrants | Kuwait | 99.9 /100 | #64 | Exceptional 8.3% |
| Immigrants | Albania | 99.9 /100 | #65 | Exceptional 8.3% |
| Luxembourgers | 99.9 /100 | #66 | Exceptional 8.3% |