Houma vs Immigrants from Southern Europe Unemployment Among Women with Children Ages 6 to 17 years
COMPARE
Houma
Immigrants from Southern Europe
Unemployment Among Women with Children Ages 6 to 17 years
Unemployment Among Women with Children Ages 6 to 17 years Comparison
Houma
Immigrants from Southern Europe
12.5%
UNEMPLOYMENT AMONG WOMEN WITH CHILDREN AGES 6 TO 17 YEARS
0.0/ 100
METRIC RATING
336th/ 347
METRIC RANK
9.2%
UNEMPLOYMENT AMONG WOMEN WITH CHILDREN AGES 6 TO 17 YEARS
5.8/ 100
METRIC RATING
222nd/ 347
METRIC RANK
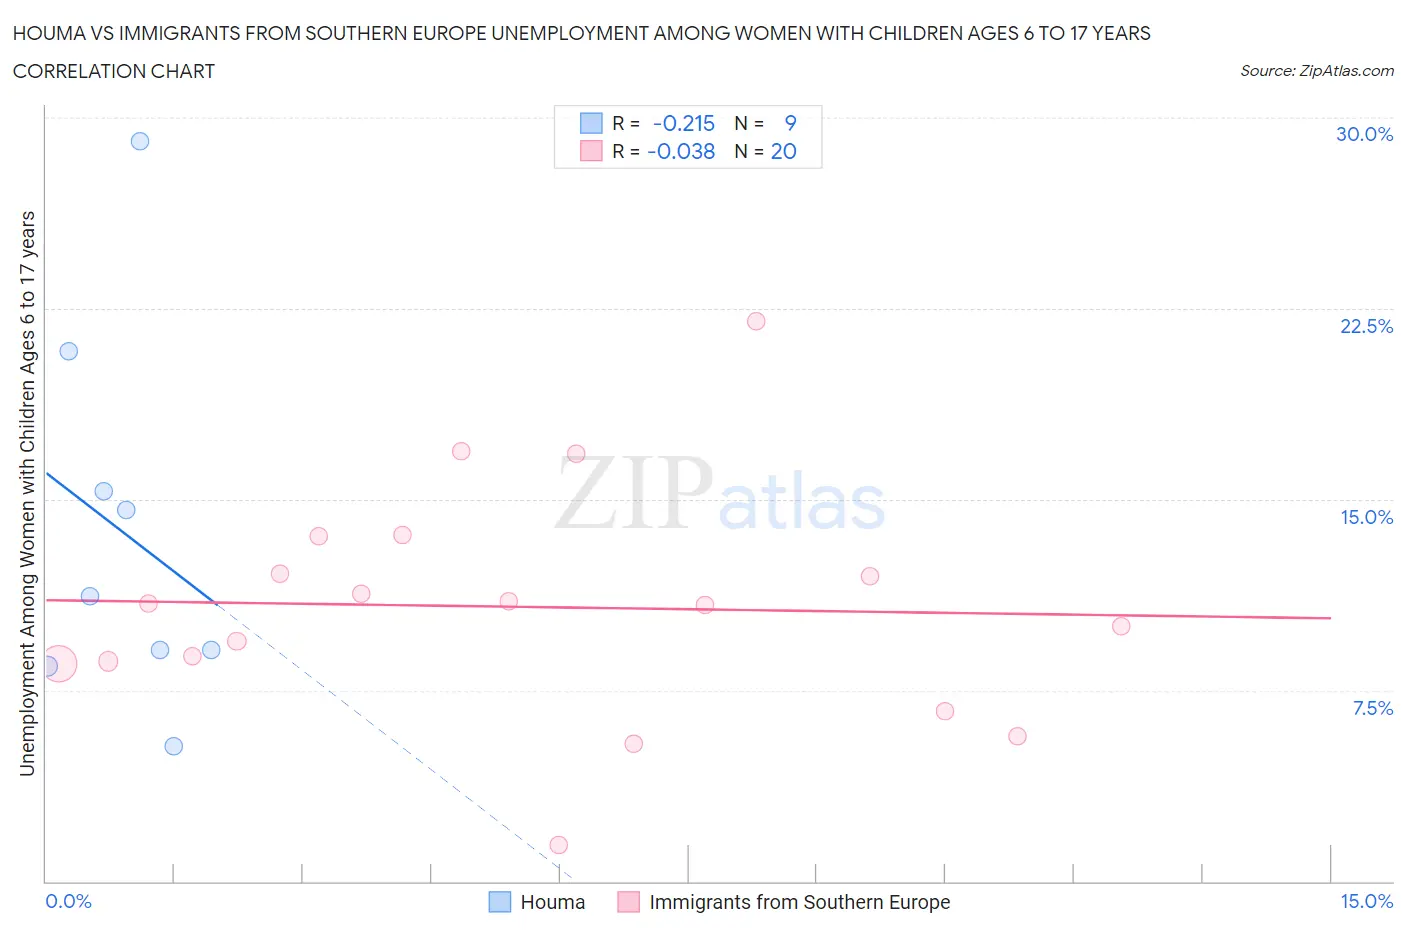
Houma vs Immigrants from Southern Europe Unemployment Among Women with Children Ages 6 to 17 years Correlation Chart
The statistical analysis conducted on geographies consisting of 33,838,816 people shows a weak negative correlation between the proportion of Houma and unemployment rate among women with children between the ages 6 and 17 in the United States with a correlation coefficient (R) of -0.215 and weighted average of 12.5%. Similarly, the statistical analysis conducted on geographies consisting of 285,916,862 people shows no correlation between the proportion of Immigrants from Southern Europe and unemployment rate among women with children between the ages 6 and 17 in the United States with a correlation coefficient (R) of -0.038 and weighted average of 9.2%, a difference of 34.9%.
Unemployment Among Women with Children Ages 6 to 17 years Correlation Summary
| Measurement | Houma | Immigrants from Southern Europe |
| Minimum | 5.3% | 1.4% |
| Maximum | 29.1% | 22.0% |
| Range | 23.8% | 20.6% |
| Mean | 13.7% | 10.8% |
| Median | 11.2% | 10.9% |
| Interquartile 25% (IQ1) | 8.8% | 8.6% |
| Interquartile 75% (IQ3) | 18.1% | 12.8% |
| Interquartile Range (IQR) | 9.3% | 4.2% |
| Standard Deviation (Sample) | 7.4% | 4.6% |
| Standard Deviation (Population) | 7.0% | 4.4% |
Similar Demographics by Unemployment Among Women with Children Ages 6 to 17 years
Demographics Similar to Houma by Unemployment Among Women with Children Ages 6 to 17 years
In terms of unemployment among women with children ages 6 to 17 years, the demographic groups most similar to Houma are Colville (12.3%, a difference of 0.97%), Immigrants from Yemen (12.7%, a difference of 1.9%), Hopi (12.9%, a difference of 3.4%), Ugandan (12.0%, a difference of 3.7%), and Sioux (13.2%, a difference of 6.2%).
| Demographics | Rating | Rank | Unemployment Among Women with Children Ages 6 to 17 years |
| Pennsylvania Germans | 0.0 /100 | #329 | Tragic 11.0% |
| Chippewa | 0.0 /100 | #330 | Tragic 11.1% |
| Blacks/African Americans | 0.0 /100 | #331 | Tragic 11.4% |
| Tsimshian | 0.0 /100 | #332 | Tragic 11.4% |
| Natives/Alaskans | 0.0 /100 | #333 | Tragic 11.5% |
| Ugandans | 0.0 /100 | #334 | Tragic 12.0% |
| Colville | 0.0 /100 | #335 | Tragic 12.3% |
| Houma | 0.0 /100 | #336 | Tragic 12.5% |
| Immigrants | Yemen | 0.0 /100 | #337 | Tragic 12.7% |
| Hopi | 0.0 /100 | #338 | Tragic 12.9% |
| Sioux | 0.0 /100 | #339 | Tragic 13.2% |
| Puerto Ricans | 0.0 /100 | #340 | Tragic 13.9% |
| Navajo | 0.0 /100 | #341 | Tragic 14.2% |
| Yuman | 0.0 /100 | #342 | Tragic 14.8% |
| Inupiat | 0.0 /100 | #343 | Tragic 14.9% |
Demographics Similar to Immigrants from Southern Europe by Unemployment Among Women with Children Ages 6 to 17 years
In terms of unemployment among women with children ages 6 to 17 years, the demographic groups most similar to Immigrants from Southern Europe are Crow (9.2%, a difference of 0.010%), Immigrants from Eritrea (9.2%, a difference of 0.010%), Immigrants from El Salvador (9.3%, a difference of 0.11%), Belgian (9.2%, a difference of 0.12%), and Chinese (9.3%, a difference of 0.12%).
| Demographics | Rating | Rank | Unemployment Among Women with Children Ages 6 to 17 years |
| Immigrants | Germany | 7.2 /100 | #215 | Tragic 9.2% |
| Immigrants | Uruguay | 7.2 /100 | #216 | Tragic 9.2% |
| Germans | 7.2 /100 | #217 | Tragic 9.2% |
| Syrians | 6.9 /100 | #218 | Tragic 9.2% |
| Immigrants | Scotland | 6.6 /100 | #219 | Tragic 9.2% |
| Belgians | 6.4 /100 | #220 | Tragic 9.2% |
| Crow | 5.8 /100 | #221 | Tragic 9.2% |
| Immigrants | Southern Europe | 5.8 /100 | #222 | Tragic 9.2% |
| Immigrants | Eritrea | 5.8 /100 | #223 | Tragic 9.2% |
| Immigrants | El Salvador | 5.3 /100 | #224 | Tragic 9.3% |
| Chinese | 5.2 /100 | #225 | Tragic 9.3% |
| Immigrants | Azores | 4.6 /100 | #226 | Tragic 9.3% |
| Panamanians | 4.5 /100 | #227 | Tragic 9.3% |
| Estonians | 4.4 /100 | #228 | Tragic 9.3% |
| Lumbee | 4.3 /100 | #229 | Tragic 9.3% |