Honduran vs Immigrants from Lebanon Unemployment
COMPARE
Honduran
Immigrants from Lebanon
Unemployment
Unemployment Comparison
Hondurans
Immigrants from Lebanon
5.7%
UNEMPLOYMENT
0.3/ 100
METRIC RATING
252nd/ 347
METRIC RANK
5.5%
UNEMPLOYMENT
7.0/ 100
METRIC RATING
227th/ 347
METRIC RANK
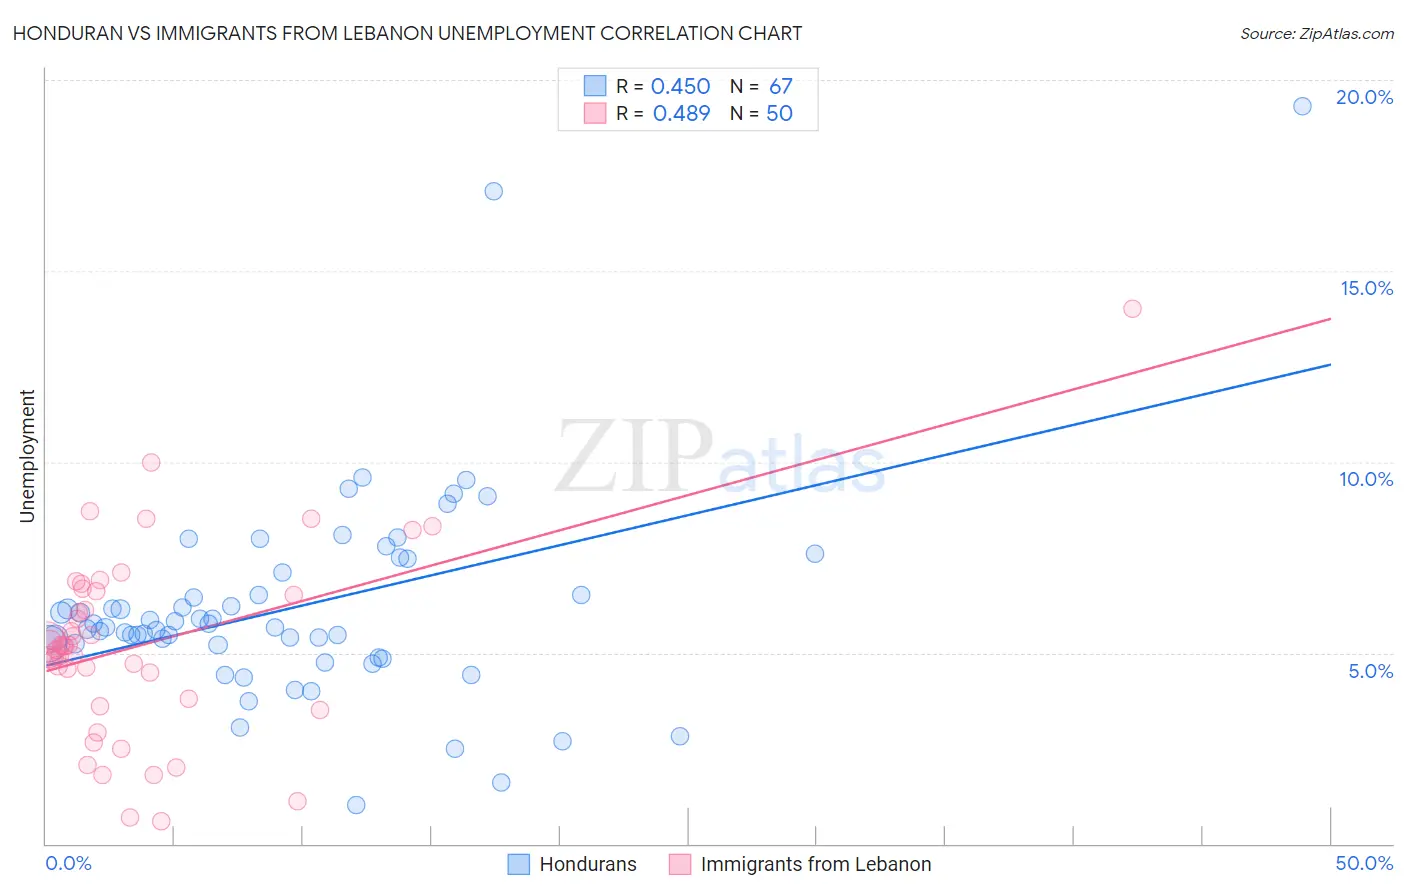
Honduran vs Immigrants from Lebanon Unemployment Correlation Chart
The statistical analysis conducted on geographies consisting of 357,563,016 people shows a moderate positive correlation between the proportion of Hondurans and unemployment in the United States with a correlation coefficient (R) of 0.450 and weighted average of 5.7%. Similarly, the statistical analysis conducted on geographies consisting of 217,130,454 people shows a moderate positive correlation between the proportion of Immigrants from Lebanon and unemployment in the United States with a correlation coefficient (R) of 0.489 and weighted average of 5.5%, a difference of 4.6%.
Unemployment Correlation Summary
| Measurement | Honduran | Immigrants from Lebanon |
| Minimum | 1.0% | 0.60% |
| Maximum | 19.3% | 14.0% |
| Range | 18.3% | 13.4% |
| Mean | 6.2% | 5.2% |
| Median | 5.7% | 5.2% |
| Interquartile 25% (IQ1) | 5.2% | 3.8% |
| Interquartile 75% (IQ3) | 7.1% | 6.6% |
| Interquartile Range (IQR) | 1.9% | 2.8% |
| Standard Deviation (Sample) | 2.8% | 2.5% |
| Standard Deviation (Population) | 2.8% | 2.5% |
Similar Demographics by Unemployment
Demographics Similar to Hondurans by Unemployment
In terms of unemployment, the demographic groups most similar to Hondurans are Central American (5.7%, a difference of 0.010%), Immigrants from Honduras (5.7%, a difference of 0.080%), Immigrants from Portugal (5.7%, a difference of 0.53%), Kiowa (5.7%, a difference of 0.74%), and Guatemalan (5.8%, a difference of 0.74%).
| Demographics | Rating | Rank | Unemployment |
| French American Indians | 1.2 /100 | #245 | Tragic 5.6% |
| Bermudans | 1.1 /100 | #246 | Tragic 5.6% |
| Immigrants | Cameroon | 1.0 /100 | #247 | Tragic 5.6% |
| Liberians | 0.9 /100 | #248 | Tragic 5.6% |
| Cajuns | 0.8 /100 | #249 | Tragic 5.6% |
| Japanese | 0.8 /100 | #250 | Tragic 5.6% |
| Kiowa | 0.6 /100 | #251 | Tragic 5.7% |
| Hondurans | 0.3 /100 | #252 | Tragic 5.7% |
| Central Americans | 0.3 /100 | #253 | Tragic 5.7% |
| Immigrants | Honduras | 0.3 /100 | #254 | Tragic 5.7% |
| Immigrants | Portugal | 0.2 /100 | #255 | Tragic 5.7% |
| Guatemalans | 0.2 /100 | #256 | Tragic 5.8% |
| Yaqui | 0.2 /100 | #257 | Tragic 5.8% |
| Immigrants | Bahamas | 0.1 /100 | #258 | Tragic 5.8% |
| Sub-Saharan Africans | 0.1 /100 | #259 | Tragic 5.8% |
Demographics Similar to Immigrants from Lebanon by Unemployment
In terms of unemployment, the demographic groups most similar to Immigrants from Lebanon are Samoan (5.5%, a difference of 0.030%), Guamanian/Chamorro (5.5%, a difference of 0.15%), South American Indian (5.5%, a difference of 0.18%), Israeli (5.4%, a difference of 0.38%), and Hawaiian (5.5%, a difference of 0.41%).
| Demographics | Rating | Rank | Unemployment |
| Soviet Union | 10.6 /100 | #220 | Poor 5.4% |
| Immigrants | Philippines | 10.4 /100 | #221 | Poor 5.4% |
| Iroquois | 10.3 /100 | #222 | Poor 5.4% |
| Seminole | 9.2 /100 | #223 | Tragic 5.4% |
| Israelis | 8.8 /100 | #224 | Tragic 5.4% |
| South American Indians | 7.8 /100 | #225 | Tragic 5.5% |
| Samoans | 7.1 /100 | #226 | Tragic 5.5% |
| Immigrants | Lebanon | 7.0 /100 | #227 | Tragic 5.5% |
| Guamanians/Chamorros | 6.3 /100 | #228 | Tragic 5.5% |
| Hawaiians | 5.4 /100 | #229 | Tragic 5.5% |
| Ottawa | 5.4 /100 | #230 | Tragic 5.5% |
| Immigrants | Africa | 4.9 /100 | #231 | Tragic 5.5% |
| Comanche | 4.9 /100 | #232 | Tragic 5.5% |
| Immigrants | Syria | 4.8 /100 | #233 | Tragic 5.5% |
| Panamanians | 4.7 /100 | #234 | Tragic 5.5% |