Honduran vs Panamanian Unemployment
COMPARE
Honduran
Panamanian
Unemployment
Unemployment Comparison
Hondurans
Panamanians
5.7%
UNEMPLOYMENT
0.3/ 100
METRIC RATING
252nd/ 347
METRIC RANK
5.5%
UNEMPLOYMENT
4.7/ 100
METRIC RATING
234th/ 347
METRIC RANK
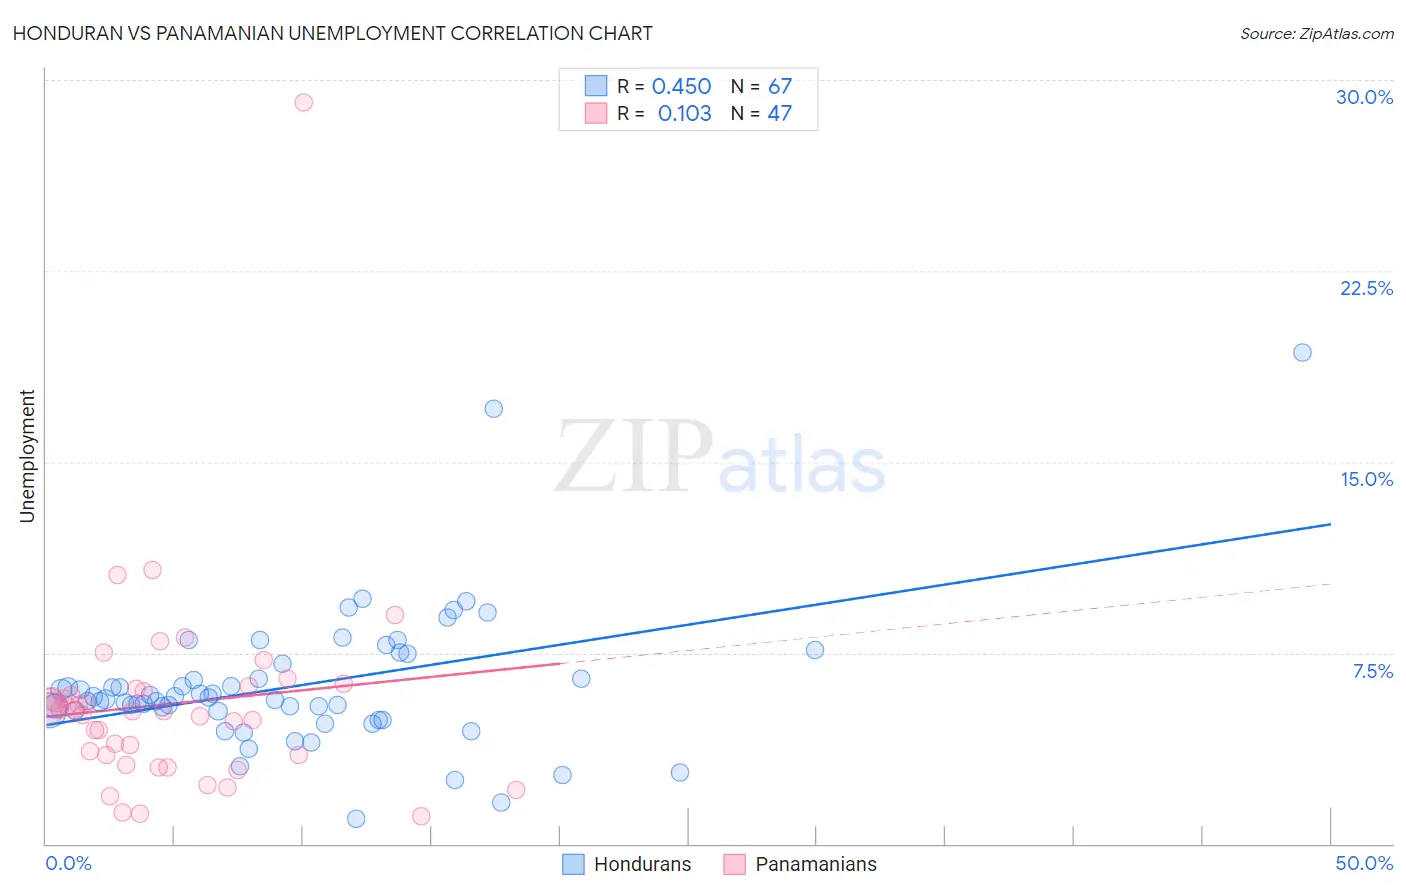
Honduran vs Panamanian Unemployment Correlation Chart
The statistical analysis conducted on geographies consisting of 357,563,016 people shows a moderate positive correlation between the proportion of Hondurans and unemployment in the United States with a correlation coefficient (R) of 0.450 and weighted average of 5.7%. Similarly, the statistical analysis conducted on geographies consisting of 281,131,526 people shows a poor positive correlation between the proportion of Panamanians and unemployment in the United States with a correlation coefficient (R) of 0.103 and weighted average of 5.5%, a difference of 3.9%.
Unemployment Correlation Summary
| Measurement | Honduran | Panamanian |
| Minimum | 1.0% | 1.1% |
| Maximum | 19.3% | 29.1% |
| Range | 18.3% | 28.0% |
| Mean | 6.2% | 5.5% |
| Median | 5.7% | 5.2% |
| Interquartile 25% (IQ1) | 5.2% | 3.5% |
| Interquartile 75% (IQ3) | 7.1% | 6.1% |
| Interquartile Range (IQR) | 1.9% | 2.6% |
| Standard Deviation (Sample) | 2.8% | 4.2% |
| Standard Deviation (Population) | 2.8% | 4.1% |
Demographics Similar to Hondurans and Panamanians by Unemployment
In terms of unemployment, the demographic groups most similar to Hondurans are Central American (5.7%, a difference of 0.010%), Kiowa (5.7%, a difference of 0.74%), Japanese (5.6%, a difference of 1.2%), Cajun (5.6%, a difference of 1.2%), and Liberian (5.6%, a difference of 1.5%). Similarly, the demographic groups most similar to Panamanians are Immigrants from Syria (5.5%, a difference of 0.030%), Immigrants from Panama (5.5%, a difference of 0.51%), Immigrants from Cambodia (5.5%, a difference of 0.54%), Moroccan (5.5%, a difference of 0.60%), and Immigrants from Western Asia (5.5%, a difference of 0.81%).
| Demographics | Rating | Rank | Unemployment |
| Immigrants | Syria | 4.8 /100 | #233 | Tragic 5.5% |
| Panamanians | 4.7 /100 | #234 | Tragic 5.5% |
| Immigrants | Panama | 3.4 /100 | #235 | Tragic 5.5% |
| Immigrants | Cambodia | 3.3 /100 | #236 | Tragic 5.5% |
| Moroccans | 3.2 /100 | #237 | Tragic 5.5% |
| Immigrants | Western Asia | 2.8 /100 | #238 | Tragic 5.5% |
| Immigrants | Immigrants | 2.6 /100 | #239 | Tragic 5.5% |
| Cree | 2.6 /100 | #240 | Tragic 5.6% |
| Tlingit-Haida | 2.0 /100 | #241 | Tragic 5.6% |
| Spanish Americans | 2.0 /100 | #242 | Tragic 5.6% |
| Marshallese | 1.3 /100 | #243 | Tragic 5.6% |
| Dutch West Indians | 1.2 /100 | #244 | Tragic 5.6% |
| French American Indians | 1.2 /100 | #245 | Tragic 5.6% |
| Bermudans | 1.1 /100 | #246 | Tragic 5.6% |
| Immigrants | Cameroon | 1.0 /100 | #247 | Tragic 5.6% |
| Liberians | 0.9 /100 | #248 | Tragic 5.6% |
| Cajuns | 0.8 /100 | #249 | Tragic 5.6% |
| Japanese | 0.8 /100 | #250 | Tragic 5.6% |
| Kiowa | 0.6 /100 | #251 | Tragic 5.7% |
| Hondurans | 0.3 /100 | #252 | Tragic 5.7% |
| Central Americans | 0.3 /100 | #253 | Tragic 5.7% |