South American Indian vs Immigrants from Belgium Unemployment Among Women with Children Ages 6 to 17 years
COMPARE
South American Indian
Immigrants from Belgium
Unemployment Among Women with Children Ages 6 to 17 years
Unemployment Among Women with Children Ages 6 to 17 years Comparison
South American Indians
Immigrants from Belgium
9.0%
UNEMPLOYMENT AMONG WOMEN WITH CHILDREN AGES 6 TO 17 YEARS
34.4/ 100
METRIC RATING
182nd/ 347
METRIC RANK
8.9%
UNEMPLOYMENT AMONG WOMEN WITH CHILDREN AGES 6 TO 17 YEARS
65.6/ 100
METRIC RATING
157th/ 347
METRIC RANK
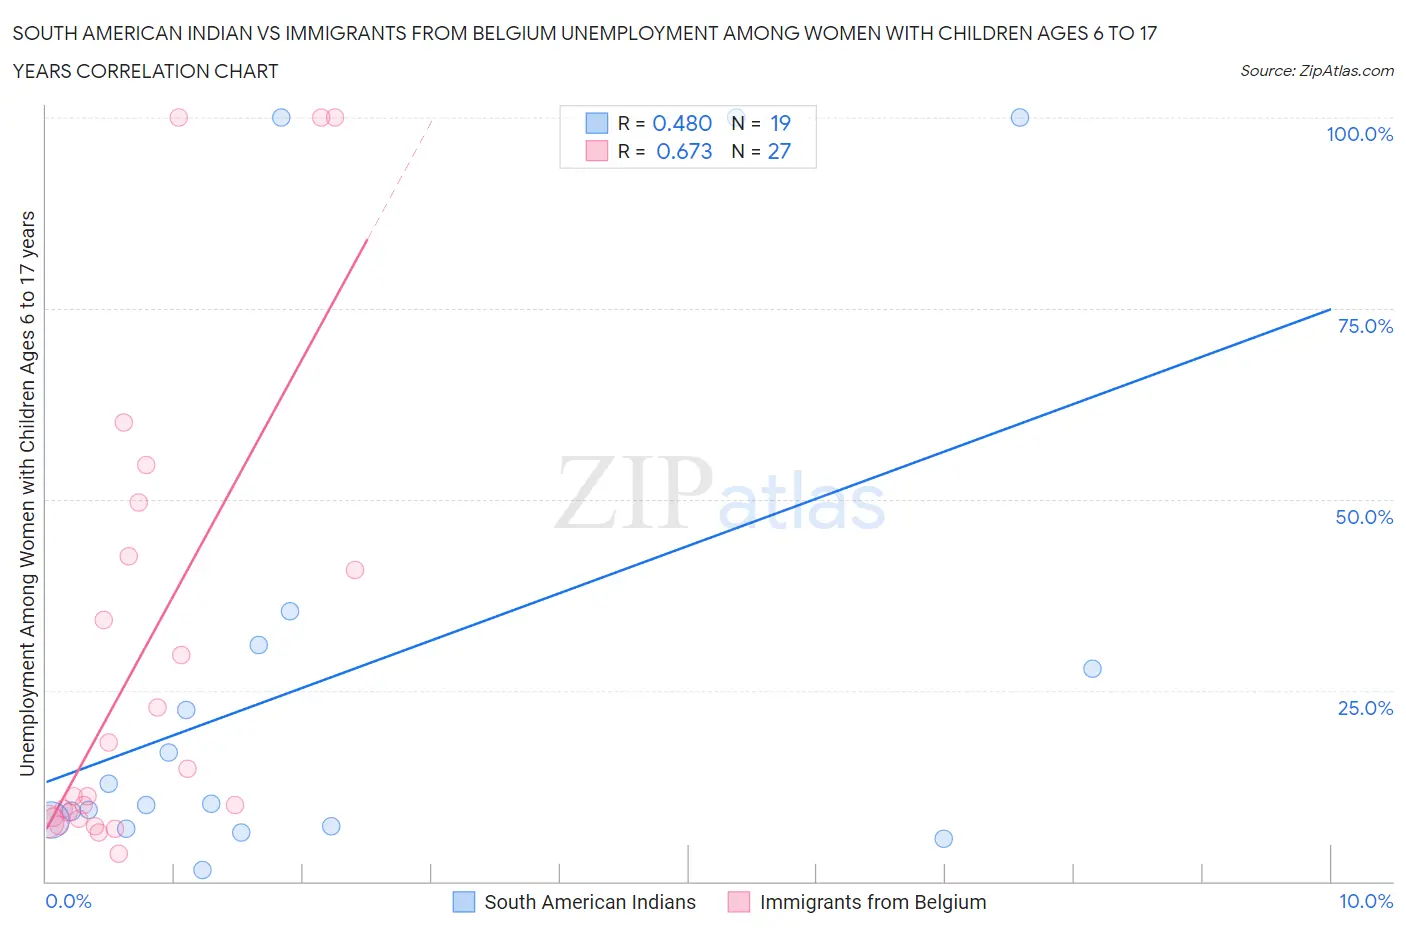
South American Indian vs Immigrants from Belgium Unemployment Among Women with Children Ages 6 to 17 years Correlation Chart
The statistical analysis conducted on geographies consisting of 138,927,659 people shows a moderate positive correlation between the proportion of South American Indians and unemployment rate among women with children between the ages 6 and 17 in the United States with a correlation coefficient (R) of 0.480 and weighted average of 9.0%. Similarly, the statistical analysis conducted on geographies consisting of 120,848,213 people shows a significant positive correlation between the proportion of Immigrants from Belgium and unemployment rate among women with children between the ages 6 and 17 in the United States with a correlation coefficient (R) of 0.673 and weighted average of 8.9%, a difference of 1.5%.
Unemployment Among Women with Children Ages 6 to 17 years Correlation Summary
| Measurement | South American Indian | Immigrants from Belgium |
| Minimum | 1.5% | 3.7% |
| Maximum | 100.0% | 100.0% |
| Range | 98.5% | 96.3% |
| Mean | 27.4% | 29.0% |
| Median | 10.1% | 11.1% |
| Interquartile 25% (IQ1) | 7.2% | 8.2% |
| Interquartile 75% (IQ3) | 30.9% | 42.5% |
| Interquartile Range (IQR) | 23.7% | 34.3% |
| Standard Deviation (Sample) | 33.6% | 30.3% |
| Standard Deviation (Population) | 32.7% | 29.8% |
Similar Demographics by Unemployment Among Women with Children Ages 6 to 17 years
Demographics Similar to South American Indians by Unemployment Among Women with Children Ages 6 to 17 years
In terms of unemployment among women with children ages 6 to 17 years, the demographic groups most similar to South American Indians are Immigrants from Czechoslovakia (9.0%, a difference of 0.010%), Swiss (9.0%, a difference of 0.050%), Palestinian (9.0%, a difference of 0.050%), Immigrants from Congo (9.0%, a difference of 0.090%), and Immigrants from Spain (9.0%, a difference of 0.10%).
| Demographics | Rating | Rank | Unemployment Among Women with Children Ages 6 to 17 years |
| Immigrants | Sierra Leone | 45.9 /100 | #175 | Average 9.0% |
| Immigrants | Italy | 43.7 /100 | #176 | Average 9.0% |
| Immigrants | Jordan | 41.6 /100 | #177 | Average 9.0% |
| Menominee | 39.3 /100 | #178 | Fair 9.0% |
| Immigrants | Zaire | 38.3 /100 | #179 | Fair 9.0% |
| Ethiopians | 37.6 /100 | #180 | Fair 9.0% |
| Immigrants | Czechoslovakia | 34.5 /100 | #181 | Fair 9.0% |
| South American Indians | 34.4 /100 | #182 | Fair 9.0% |
| Swiss | 33.5 /100 | #183 | Fair 9.0% |
| Palestinians | 33.4 /100 | #184 | Fair 9.0% |
| Immigrants | Congo | 32.5 /100 | #185 | Fair 9.0% |
| Immigrants | Spain | 32.4 /100 | #186 | Fair 9.0% |
| Comanche | 30.0 /100 | #187 | Fair 9.0% |
| Immigrants | Syria | 29.7 /100 | #188 | Fair 9.1% |
| Immigrants | Immigrants | 29.2 /100 | #189 | Fair 9.1% |
Demographics Similar to Immigrants from Belgium by Unemployment Among Women with Children Ages 6 to 17 years
In terms of unemployment among women with children ages 6 to 17 years, the demographic groups most similar to Immigrants from Belgium are Osage (8.9%, a difference of 0.010%), Immigrants from Chile (8.9%, a difference of 0.010%), Spanish (8.9%, a difference of 0.090%), Immigrants from Hungary (8.9%, a difference of 0.11%), and Immigrants from Guyana (8.9%, a difference of 0.13%).
| Demographics | Rating | Rank | Unemployment Among Women with Children Ages 6 to 17 years |
| Greeks | 75.2 /100 | #150 | Good 8.9% |
| Immigrants | Eastern Africa | 74.6 /100 | #151 | Good 8.9% |
| Immigrants | Northern Europe | 74.6 /100 | #152 | Good 8.9% |
| Immigrants | Europe | 73.4 /100 | #153 | Good 8.9% |
| Vietnamese | 72.1 /100 | #154 | Good 8.9% |
| Immigrants | Greece | 71.8 /100 | #155 | Good 8.9% |
| Osage | 65.9 /100 | #156 | Good 8.9% |
| Immigrants | Belgium | 65.6 /100 | #157 | Good 8.9% |
| Immigrants | Chile | 65.3 /100 | #158 | Good 8.9% |
| Spanish | 63.8 /100 | #159 | Good 8.9% |
| Immigrants | Hungary | 63.4 /100 | #160 | Good 8.9% |
| Immigrants | Guyana | 63.0 /100 | #161 | Good 8.9% |
| Immigrants | Netherlands | 60.8 /100 | #162 | Good 8.9% |
| Mexican American Indians | 60.6 /100 | #163 | Good 8.9% |
| Ukrainians | 59.7 /100 | #164 | Average 8.9% |