Brazilian vs Immigrants from Somalia Unemployment Among Women with Children Under 6 years
COMPARE
Brazilian
Immigrants from Somalia
Unemployment Among Women with Children Under 6 years
Unemployment Among Women with Children Under 6 years Comparison
Brazilians
Immigrants from Somalia
7.7%
UNEMPLOYMENT AMONG WOMEN WITH CHILDREN UNDER 6 YEARS
43.9/ 100
METRIC RATING
181st/ 347
METRIC RANK
7.1%
UNEMPLOYMENT AMONG WOMEN WITH CHILDREN UNDER 6 YEARS
98.9/ 100
METRIC RATING
78th/ 347
METRIC RANK
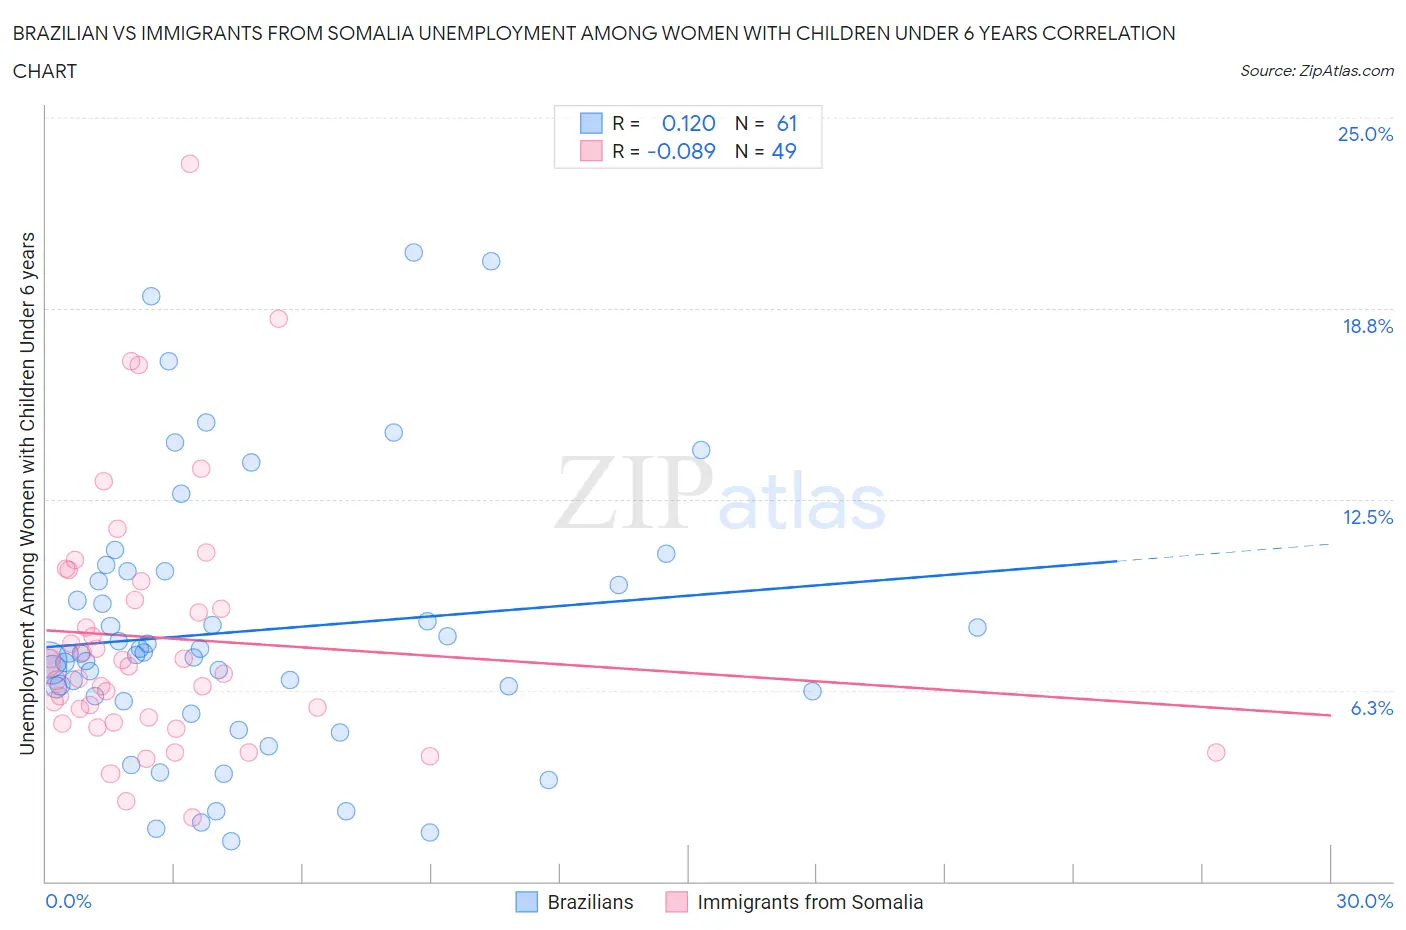
Brazilian vs Immigrants from Somalia Unemployment Among Women with Children Under 6 years Correlation Chart
The statistical analysis conducted on geographies consisting of 256,263,752 people shows a poor positive correlation between the proportion of Brazilians and unemployment rate among women with children under the age of 6 in the United States with a correlation coefficient (R) of 0.120 and weighted average of 7.7%. Similarly, the statistical analysis conducted on geographies consisting of 84,437,163 people shows a slight negative correlation between the proportion of Immigrants from Somalia and unemployment rate among women with children under the age of 6 in the United States with a correlation coefficient (R) of -0.089 and weighted average of 7.1%, a difference of 8.5%.
Unemployment Among Women with Children Under 6 years Correlation Summary
| Measurement | Brazilian | Immigrants from Somalia |
| Minimum | 1.3% | 2.1% |
| Maximum | 20.6% | 23.5% |
| Range | 19.3% | 21.4% |
| Mean | 8.2% | 8.0% |
| Median | 7.5% | 7.1% |
| Interquartile 25% (IQ1) | 6.0% | 5.3% |
| Interquartile 75% (IQ3) | 10.0% | 9.5% |
| Interquartile Range (IQR) | 4.0% | 4.2% |
| Standard Deviation (Sample) | 4.4% | 4.2% |
| Standard Deviation (Population) | 4.4% | 4.2% |
Similar Demographics by Unemployment Among Women with Children Under 6 years
Demographics Similar to Brazilians by Unemployment Among Women with Children Under 6 years
In terms of unemployment among women with children under 6 years, the demographic groups most similar to Brazilians are Nepalese (7.7%, a difference of 0.020%), Immigrants from Uruguay (7.7%, a difference of 0.040%), Immigrants from Western Europe (7.7%, a difference of 0.070%), Sierra Leonean (7.7%, a difference of 0.070%), and Immigrants from England (7.7%, a difference of 0.10%).
| Demographics | Rating | Rank | Unemployment Among Women with Children Under 6 years |
| Immigrants | Laos | 50.0 /100 | #174 | Average 7.6% |
| Panamanians | 49.6 /100 | #175 | Average 7.6% |
| Puget Sound Salish | 47.7 /100 | #176 | Average 7.7% |
| Austrians | 46.0 /100 | #177 | Average 7.7% |
| Immigrants | England | 45.4 /100 | #178 | Average 7.7% |
| Immigrants | Western Europe | 44.9 /100 | #179 | Average 7.7% |
| Immigrants | Uruguay | 44.5 /100 | #180 | Average 7.7% |
| Brazilians | 43.9 /100 | #181 | Average 7.7% |
| Nepalese | 43.5 /100 | #182 | Average 7.7% |
| Sierra Leoneans | 42.9 /100 | #183 | Average 7.7% |
| Indonesians | 40.5 /100 | #184 | Average 7.7% |
| Spanish Americans | 39.7 /100 | #185 | Fair 7.7% |
| Yugoslavians | 39.4 /100 | #186 | Fair 7.7% |
| Immigrants | Thailand | 38.5 /100 | #187 | Fair 7.7% |
| Czechoslovakians | 38.4 /100 | #188 | Fair 7.7% |
Demographics Similar to Immigrants from Somalia by Unemployment Among Women with Children Under 6 years
In terms of unemployment among women with children under 6 years, the demographic groups most similar to Immigrants from Somalia are Immigrants from Croatia (7.1%, a difference of 0.040%), Immigrants from Fiji (7.1%, a difference of 0.050%), Estonian (7.1%, a difference of 0.070%), Immigrants from Greece (7.1%, a difference of 0.070%), and Immigrants from Venezuela (7.1%, a difference of 0.11%).
| Demographics | Rating | Rank | Unemployment Among Women with Children Under 6 years |
| Afghans | 99.4 /100 | #71 | Exceptional 7.0% |
| Cubans | 99.4 /100 | #72 | Exceptional 7.0% |
| Immigrants | Czechoslovakia | 99.2 /100 | #73 | Exceptional 7.0% |
| Turks | 99.2 /100 | #74 | Exceptional 7.0% |
| Immigrants | Eastern Europe | 99.0 /100 | #75 | Exceptional 7.1% |
| Estonians | 99.0 /100 | #76 | Exceptional 7.1% |
| Immigrants | Croatia | 98.9 /100 | #77 | Exceptional 7.1% |
| Immigrants | Somalia | 98.9 /100 | #78 | Exceptional 7.1% |
| Immigrants | Fiji | 98.9 /100 | #79 | Exceptional 7.1% |
| Immigrants | Greece | 98.9 /100 | #80 | Exceptional 7.1% |
| Immigrants | Venezuela | 98.8 /100 | #81 | Exceptional 7.1% |
| Immigrants | Afghanistan | 98.7 /100 | #82 | Exceptional 7.1% |
| Egyptians | 98.7 /100 | #83 | Exceptional 7.1% |
| Immigrants | Albania | 98.7 /100 | #84 | Exceptional 7.1% |
| Immigrants | Romania | 98.7 /100 | #85 | Exceptional 7.1% |