Guatemalan vs Pueblo Female Unemployment
COMPARE
Guatemalan
Pueblo
Female Unemployment
Female Unemployment Comparison
Guatemalans
Pueblo
6.0%
FEMALE UNEMPLOYMENT
0.0/ 100
METRIC RATING
281st/ 347
METRIC RANK
6.4%
FEMALE UNEMPLOYMENT
0.0/ 100
METRIC RATING
315th/ 347
METRIC RANK
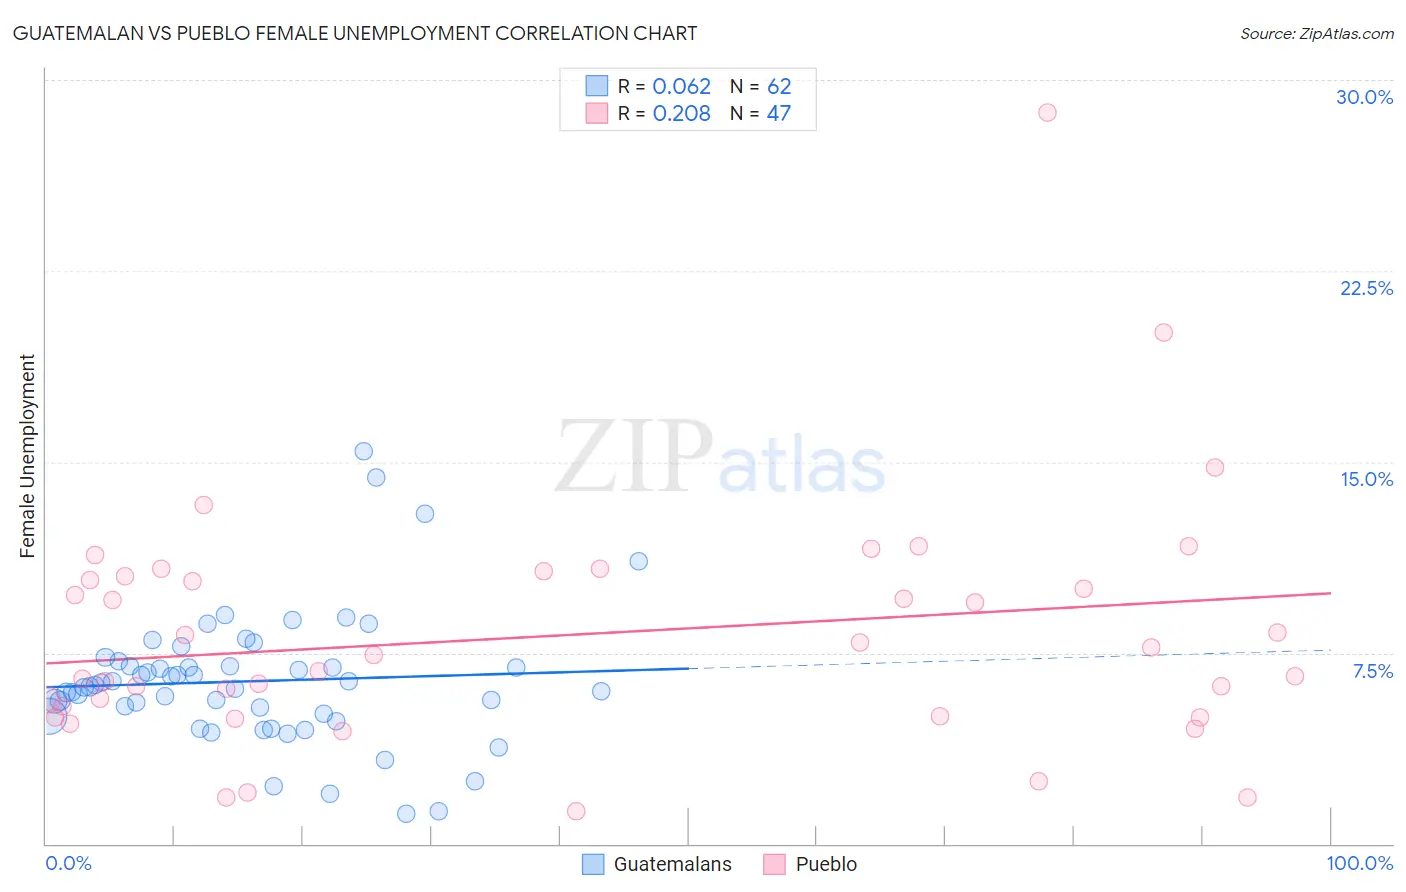
Guatemalan vs Pueblo Female Unemployment Correlation Chart
The statistical analysis conducted on geographies consisting of 407,606,729 people shows a slight positive correlation between the proportion of Guatemalans and unemploymnet rate among females in the United States with a correlation coefficient (R) of 0.062 and weighted average of 6.0%. Similarly, the statistical analysis conducted on geographies consisting of 119,838,706 people shows a weak positive correlation between the proportion of Pueblo and unemploymnet rate among females in the United States with a correlation coefficient (R) of 0.208 and weighted average of 6.4%, a difference of 6.0%.
Female Unemployment Correlation Summary
| Measurement | Guatemalan | Pueblo |
| Minimum | 1.2% | 1.3% |
| Maximum | 15.4% | 28.7% |
| Range | 14.2% | 27.4% |
| Mean | 6.4% | 8.2% |
| Median | 6.2% | 7.4% |
| Interquartile 25% (IQ1) | 5.1% | 5.0% |
| Interquartile 75% (IQ3) | 7.0% | 10.5% |
| Interquartile Range (IQR) | 1.9% | 5.5% |
| Standard Deviation (Sample) | 2.6% | 4.8% |
| Standard Deviation (Population) | 2.6% | 4.7% |
Similar Demographics by Female Unemployment
Demographics Similar to Guatemalans by Female Unemployment
In terms of female unemployment, the demographic groups most similar to Guatemalans are Mexican American Indian (6.0%, a difference of 0.040%), Armenian (6.0%, a difference of 0.090%), Immigrants from Ghana (6.0%, a difference of 0.21%), Yaqui (6.0%, a difference of 0.21%), and Colville (6.0%, a difference of 0.27%).
| Demographics | Rating | Rank | Female Unemployment |
| Africans | 0.0 /100 | #274 | Tragic 5.9% |
| Senegalese | 0.0 /100 | #275 | Tragic 6.0% |
| Bahamians | 0.0 /100 | #276 | Tragic 6.0% |
| Immigrants | Ghana | 0.0 /100 | #277 | Tragic 6.0% |
| Yaqui | 0.0 /100 | #278 | Tragic 6.0% |
| Armenians | 0.0 /100 | #279 | Tragic 6.0% |
| Mexican American Indians | 0.0 /100 | #280 | Tragic 6.0% |
| Guatemalans | 0.0 /100 | #281 | Tragic 6.0% |
| Colville | 0.0 /100 | #282 | Tragic 6.0% |
| Salvadorans | 0.0 /100 | #283 | Tragic 6.0% |
| Immigrants | Senegal | 0.0 /100 | #284 | Tragic 6.1% |
| Immigrants | Cabo Verde | 0.0 /100 | #285 | Tragic 6.1% |
| Chippewa | 0.0 /100 | #286 | Tragic 6.1% |
| Immigrants | Guatemala | 0.0 /100 | #287 | Tragic 6.1% |
| Haitians | 0.0 /100 | #288 | Tragic 6.1% |
Demographics Similar to Pueblo by Female Unemployment
In terms of female unemployment, the demographic groups most similar to Pueblo are Houma (6.4%, a difference of 0.29%), Immigrants from Ecuador (6.4%, a difference of 0.31%), Belizean (6.3%, a difference of 0.54%), Immigrants from Grenada (6.3%, a difference of 0.55%), and Immigrants from St. Vincent and the Grenadines (6.4%, a difference of 0.74%).
| Demographics | Rating | Rank | Female Unemployment |
| Hispanics or Latinos | 0.0 /100 | #308 | Tragic 6.2% |
| Ecuadorians | 0.0 /100 | #309 | Tragic 6.3% |
| Central American Indians | 0.0 /100 | #310 | Tragic 6.3% |
| Immigrants | Mexico | 0.0 /100 | #311 | Tragic 6.3% |
| Immigrants | Grenada | 0.0 /100 | #312 | Tragic 6.3% |
| Belizeans | 0.0 /100 | #313 | Tragic 6.3% |
| Immigrants | Ecuador | 0.0 /100 | #314 | Tragic 6.4% |
| Pueblo | 0.0 /100 | #315 | Tragic 6.4% |
| Houma | 0.0 /100 | #316 | Tragic 6.4% |
| Immigrants | St. Vincent and the Grenadines | 0.0 /100 | #317 | Tragic 6.4% |
| British West Indians | 0.0 /100 | #318 | Tragic 6.4% |
| Immigrants | Bangladesh | 0.0 /100 | #319 | Tragic 6.5% |
| Immigrants | Dominica | 0.0 /100 | #320 | Tragic 6.5% |
| Blacks/African Americans | 0.0 /100 | #321 | Tragic 6.5% |
| Vietnamese | 0.0 /100 | #322 | Tragic 6.5% |