New Zealander vs Pueblo Female Unemployment

COMPARE

New Zealander
Race
Ancestry
AfghanAfricanAlaska NativeAlaskan AthabascanAlbanianAleutAlsatianAmericanApacheArabArapahoArgentineanArmenianAssyrian/Chaldean/SyriacAustralianAustrianBahamianBangladeshiBarbadianBasqueBelgianBelizeanBermudanBhutaneseBlackfeetBolivianBrazilianBritishBritish West IndianBulgarianBurmeseCajunCambodianCanadianCape VerdeanCarpatho RusynCelticCentral AmericanCentral American IndianCherokeeCheyenneChickasawChileanChineseChippewaChoctawColombianColvilleComancheCosta RicanCreeCreekCroatianCrowCubanCypriotCzechCzechoslovakianDanishDelawareDominicanDutchDutch West IndianEastern EuropeanEcuadorianEgyptianEnglishEstonianEthiopianEuropeanFijianFilipinoFinnishFrenchFrench American IndianFrench CanadianGermanGerman RussianGhanaianGreekGuamanian/ChamorroGuatemalanGuyaneseHaitianHmongHonduranHopiHoumaHungarianIcelanderIndian (Asian)IndonesianInupiatIranianIraqiIrishIroquoisIsraeliItalianJamaicanJapaneseJordanianKenyanKiowaKoreanLaotianLatvianLebaneseLiberianLithuanianLumbeeLuxembourgerMacedonianMalaysianMalteseMarshalleseMenomineeMexicanMexican American IndianMongolianMoroccanNative HawaiianNavajoNepaleseNew ZealanderNicaraguanNigerianNorthern EuropeanNorwegianOkinawanOsageOttawaPaiutePakistaniPalestinianPanamanianParaguayanPennsylvania GermanPeruvianPimaPolishPortuguesePotawatomiPuerto RicanPuget Sound SalishRomanianRussianSalvadoranSamoanScandinavianScotch-IrishScottishSeminoleSenegaleseSerbianShoshoneSierra LeoneanSiouxSlavicSlovakSloveneSomaliSouth AfricanSouth AmericanSouth American IndianSoviet UnionSpaniardSpanishSpanish AmericanSpanish American IndianSri LankanSubsaharan AfricanSudaneseSwedishSwissSyrianTaiwaneseThaiTlingit-HaidaTohono O'OdhamTonganTrinidadian and TobagonianTsimshianTurkishU.S. Virgin IslanderUgandanUkrainianUruguayanUteVenezuelanVietnameseWelshWest IndianYakamaYaquiYugoslavianYumanYup'ikZimbabwean
Immigration
NonimmigrantsImmigrantsAfghanistanAfricaAlbaniaArgentinaArmeniaAsiaAustraliaAustriaBahamasBangladeshBarbadosBelarusBelgiumBelizeBoliviaBosnia and HerzegovinaBrazilBulgariaBurma/MyanmarCabo VerdeCambodiaCameroonCanadaCaribbeanCentral AmericaChileChinaColombiaCongoCosta RicaCroatiaCubaCzechoslovakiaDenmarkDominicaDominican RepublicEastern AfricaEastern AsiaEastern EuropeEcuadorEgyptEl SalvadorEnglandEritreaEthiopiaEuropeFijiFranceGermanyGhanaGreeceGrenadaGuatemalaGuyanaHaitiHondurasHong KongHungaryIndiaIndonesiaIranIraqIrelandIsraelItalyJamaicaJapanJordanKazakhstanKenyaKoreaKuwaitLaosLatin AmericaLatviaLebanonLiberiaLithuaniaMalaysiaMexicoMicronesiaMiddle AfricaMoldovaMoroccoNepalNetherlandsNicaraguaNigeriaNorth AmericaNorth MacedoniaNorthern AfricaNorthern EuropeNorwayOceaniaPakistanPanamaPeruPhilippinesPolandPortugalRomaniaRussiaSaudi ArabiaScotlandSenegalSerbiaSierra LeoneSingaporeSomaliaSouth AfricaSouth AmericaSouth Central AsiaSouth Eastern AsiaSouthern EuropeSpainSri LankaSt. Vincent and the GrenadinesSudanSwedenSwitzerlandSyriaTaiwanThailandTrinidad and TobagoTurkeyUgandaUkraineUruguayUzbekistanVenezuelaVietnamWest IndiesWestern AfricaWestern AsiaWestern EuropeYemenZaireZimbabweAzores
Pueblo
Race
Ancestry
AfghanAfricanAlaska NativeAlaskan AthabascanAlbanianAleutAlsatianAmericanApacheArabArapahoArgentineanArmenianAssyrian/Chaldean/SyriacAustralianAustrianBahamianBangladeshiBarbadianBasqueBelgianBelizeanBermudanBhutaneseBlackfeetBolivianBrazilianBritishBritish West IndianBulgarianBurmeseCajunCambodianCanadianCape VerdeanCarpatho RusynCelticCentral AmericanCentral American IndianCherokeeCheyenneChickasawChileanChineseChippewaChoctawColombianColvilleComancheCosta RicanCreeCreekCroatianCrowCubanCypriotCzechCzechoslovakianDanishDelawareDominicanDutchDutch West IndianEastern EuropeanEcuadorianEgyptianEnglishEstonianEthiopianEuropeanFijianFilipinoFinnishFrenchFrench American IndianFrench CanadianGermanGerman RussianGhanaianGreekGuamanian/ChamorroGuatemalanGuyaneseHaitianHmongHonduranHopiHoumaHungarianIcelanderIndian (Asian)IndonesianInupiatIranianIraqiIrishIroquoisIsraeliItalianJamaicanJapaneseJordanianKenyanKiowaKoreanLaotianLatvianLebaneseLiberianLithuanianLumbeeLuxembourgerMacedonianMalaysianMalteseMarshalleseMenomineeMexicanMexican American IndianMongolianMoroccanNative HawaiianNavajoNepaleseNicaraguanNigerianNorthern EuropeanNorwegianOkinawanOsageOttawaPaiutePakistaniPalestinianPanamanianParaguayanPennsylvania GermanPeruvianPimaPolishPortuguesePotawatomiPuebloPuerto RicanPuget Sound SalishRomanianRussianSalvadoranSamoanScandinavianScotch-IrishScottishSeminoleSenegaleseSerbianShoshoneSierra LeoneanSiouxSlavicSlovakSloveneSomaliSouth AfricanSouth AmericanSouth American IndianSoviet UnionSpaniardSpanishSpanish AmericanSpanish American IndianSri LankanSubsaharan AfricanSudaneseSwedishSwissSyrianTaiwaneseThaiTlingit-HaidaTohono O'OdhamTonganTrinidadian and TobagonianTsimshianTurkishU.S. Virgin IslanderUgandanUkrainianUruguayanUteVenezuelanVietnameseWelshWest IndianYakamaYaquiYugoslavianYumanYup'ikZimbabwean
Immigration
NonimmigrantsImmigrantsAfghanistanAfricaAlbaniaArgentinaArmeniaAsiaAustraliaAustriaBahamasBangladeshBarbadosBelarusBelgiumBelizeBoliviaBosnia and HerzegovinaBrazilBulgariaBurma/MyanmarCabo VerdeCambodiaCameroonCanadaCaribbeanCentral AmericaChileChinaColombiaCongoCosta RicaCroatiaCubaCzechoslovakiaDenmarkDominicaDominican RepublicEastern AfricaEastern AsiaEastern EuropeEcuadorEgyptEl SalvadorEnglandEritreaEthiopiaEuropeFijiFranceGermanyGhanaGreeceGrenadaGuatemalaGuyanaHaitiHondurasHong KongHungaryIndiaIndonesiaIranIraqIrelandIsraelItalyJamaicaJapanJordanKazakhstanKenyaKoreaKuwaitLaosLatin AmericaLatviaLebanonLiberiaLithuaniaMalaysiaMexicoMicronesiaMiddle AfricaMoldovaMoroccoNepalNetherlandsNicaraguaNigeriaNorth AmericaNorth MacedoniaNorthern AfricaNorthern EuropeNorwayOceaniaPakistanPanamaPeruPhilippinesPolandPortugalRomaniaRussiaSaudi ArabiaScotlandSenegalSerbiaSierra LeoneSingaporeSomaliaSouth AfricaSouth AmericaSouth Central AsiaSouth Eastern AsiaSouthern EuropeSpainSri LankaSt. Vincent and the GrenadinesSudanSwedenSwitzerlandSyriaTaiwanThailandTrinidad and TobagoTurkeyUgandaUkraineUruguayUzbekistanVenezuelaVietnamWest IndiesWestern AfricaWestern AsiaWestern EuropeYemenZaireZimbabweAzores
Female Unemployment
Income
Poverty
Unemployment
Labor Participation
Family Structure
Vehicle Availability
Education Level
Disability

Female Unemployment Comparison

New Zealanders

Pueblo

Exceptional
Tragic
5.0%
FEMALE UNEMPLOYMENT
97.4/ 100
METRIC RATING
80th/ 347
METRIC RANK
6.4%
FEMALE UNEMPLOYMENT
0.0/ 100
METRIC RATING
315th/ 347
METRIC RANK

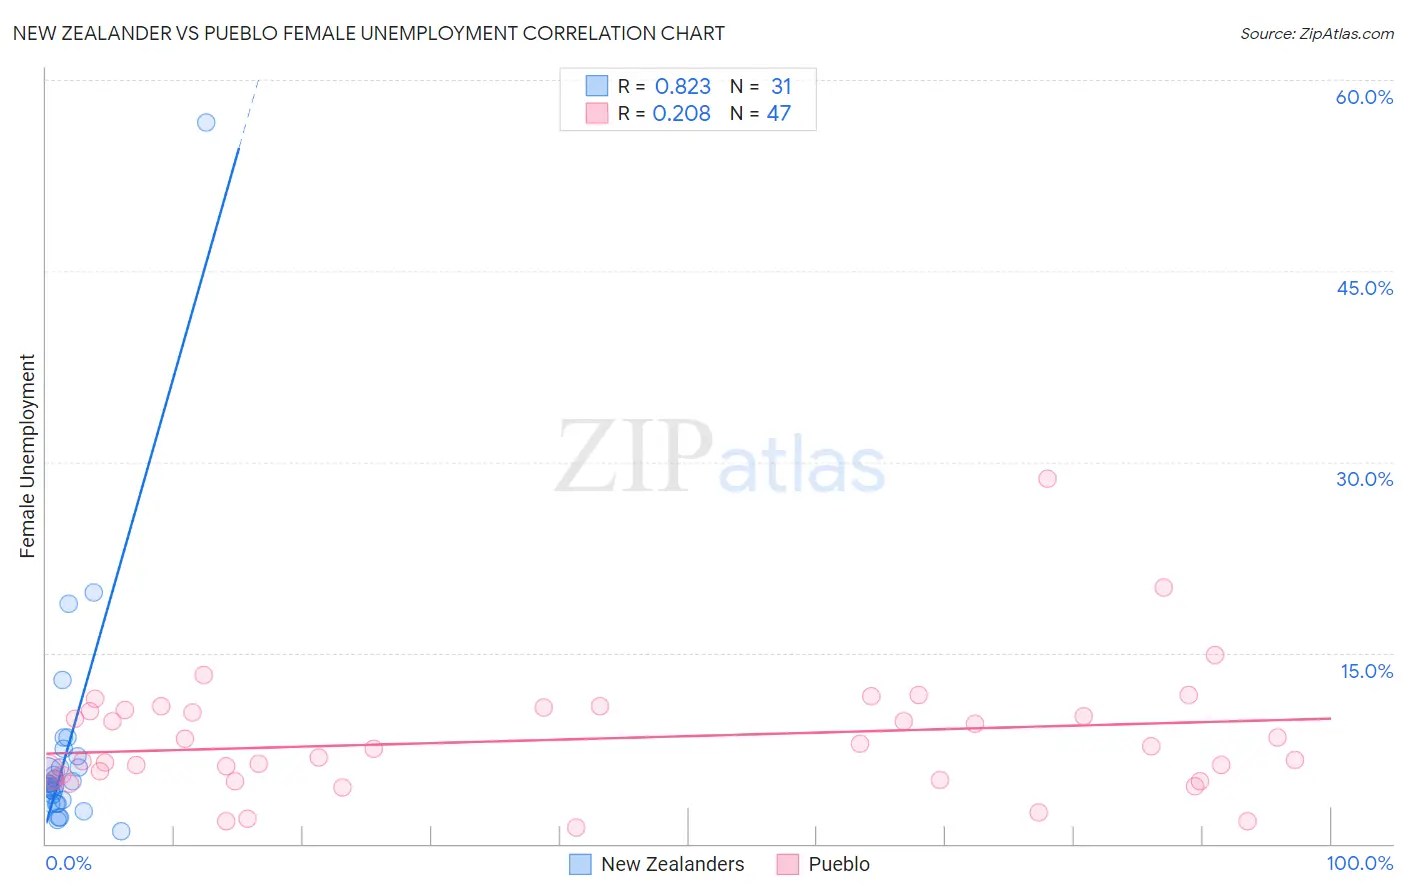
New Zealander vs Pueblo Female Unemployment Correlation Chart

The statistical analysis conducted on geographies consisting of 106,766,859 people shows a very strong positive correlation between the proportion of New Zealanders and unemploymnet rate among females in the United States with a correlation coefficient (R) of 0.823 and weighted average of 5.0%. Similarly, the statistical analysis conducted on geographies consisting of 119,838,706 people shows a weak positive correlation between the proportion of Pueblo and unemploymnet rate among females in the United States with a correlation coefficient (R) of 0.208 and weighted average of 6.4%, a difference of 28.3%.
New Zealander vs Pueblo Female Unemployment

Female Unemployment Correlation Summary

MeasurementNew ZealanderPueblo
Minimum1.0%1.3%
Maximum56.7%28.7%
Range55.7%27.4%
Mean7.4%8.2%
Median4.7%7.4%
Interquartile 25% (IQ1)3.2%5.0%
Interquartile 75% (IQ3)6.9%10.5%
Interquartile Range (IQR)3.7%5.5%
Standard Deviation (Sample)10.1%4.8%
Standard Deviation (Population)9.9%4.7%

Similar Demographics by Female Unemployment

Demographics Similar to New Zealanders by Female Unemployment

In terms of female unemployment, the demographic groups most similar to New Zealanders are Filipino (5.0%, a difference of 0.020%), Immigrants from Australia (5.0%, a difference of 0.070%), Immigrants from Serbia (5.0%, a difference of 0.090%), Turkish (5.0%, a difference of 0.12%), and Canadian (5.0%, a difference of 0.13%).
DemographicsRating | RankFemale Unemployment
Russians
98.0
/100
|
#73
Exceptional
5.0%
Immigrants | Bolivia
98.0
/100
|
#74
Exceptional
5.0%
Immigrants | Singapore
98.0
/100
|
#75
Exceptional
5.0%
Immigrants | Venezuela
97.9
/100
|
#76
Exceptional
5.0%
Mongolians
97.8
/100
|
#77
Exceptional
5.0%
Immigrants | Netherlands
97.8
/100
|
#78
Exceptional
5.0%
Turks
97.6
/100
|
#79
Exceptional
5.0%
New Zealanders
97.4
/100
|
#80
Exceptional
5.0%
Filipinos
97.3
/100
|
#81
Exceptional
5.0%
Immigrants | Australia
97.3
/100
|
#82
Exceptional
5.0%
Immigrants | Serbia
97.2
/100
|
#83
Exceptional
5.0%
Canadians
97.2
/100
|
#84
Exceptional
5.0%
Ukrainians
97.1
/100
|
#85
Exceptional
5.0%
Bolivians
97.1
/100
|
#86
Exceptional
5.0%
Venezuelans
96.9
/100
|
#87
Exceptional
5.0%

Demographics Similar to Pueblo by Female Unemployment

In terms of female unemployment, the demographic groups most similar to Pueblo are Houma (6.4%, a difference of 0.29%), Immigrants from Ecuador (6.4%, a difference of 0.31%), Belizean (6.3%, a difference of 0.54%), Immigrants from Grenada (6.3%, a difference of 0.55%), and Immigrants from St. Vincent and the Grenadines (6.4%, a difference of 0.74%).
DemographicsRating | RankFemale Unemployment
Hispanics or Latinos
0.0
/100
|
#308
Tragic
6.2%
Ecuadorians
0.0
/100
|
#309
Tragic
6.3%
Central American Indians
0.0
/100
|
#310
Tragic
6.3%
Immigrants | Mexico
0.0
/100
|
#311
Tragic
6.3%
Immigrants | Grenada
0.0
/100
|
#312
Tragic
6.3%
Belizeans
0.0
/100
|
#313
Tragic
6.3%
Immigrants | Ecuador
0.0
/100
|
#314
Tragic
6.4%
Pueblo
0.0
/100
|
#315
Tragic
6.4%
Houma
0.0
/100
|
#316
Tragic
6.4%
Immigrants | St. Vincent and the Grenadines
0.0
/100
|
#317
Tragic
6.4%
British West Indians
0.0
/100
|
#318
Tragic
6.4%
Immigrants | Bangladesh
0.0
/100
|
#319
Tragic
6.5%
Immigrants | Dominica
0.0
/100
|
#320
Tragic
6.5%
Blacks/African Americans
0.0
/100
|
#321
Tragic
6.5%
Vietnamese
0.0
/100
|
#322
Tragic
6.5%