Delaware vs Pueblo Female Unemployment
COMPARE
Delaware
Pueblo
Female Unemployment
Female Unemployment Comparison
Delaware
Pueblo
5.5%
FEMALE UNEMPLOYMENT
7.2/ 100
METRIC RATING
223rd/ 347
METRIC RANK
6.4%
FEMALE UNEMPLOYMENT
0.0/ 100
METRIC RATING
315th/ 347
METRIC RANK
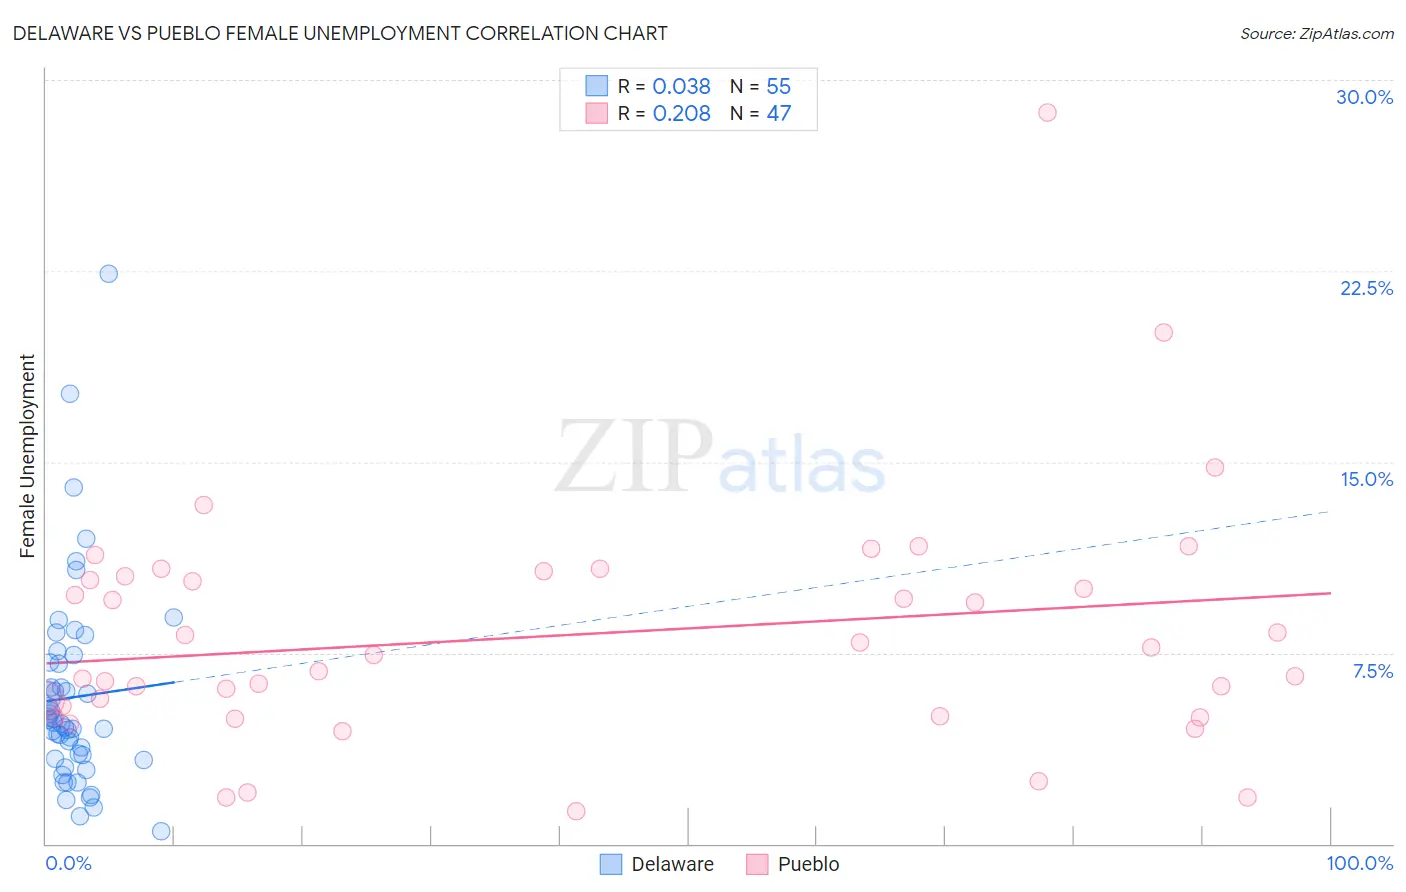
Delaware vs Pueblo Female Unemployment Correlation Chart
The statistical analysis conducted on geographies consisting of 96,046,928 people shows no correlation between the proportion of Delaware and unemploymnet rate among females in the United States with a correlation coefficient (R) of 0.038 and weighted average of 5.5%. Similarly, the statistical analysis conducted on geographies consisting of 119,838,706 people shows a weak positive correlation between the proportion of Pueblo and unemploymnet rate among females in the United States with a correlation coefficient (R) of 0.208 and weighted average of 6.4%, a difference of 16.8%.
Female Unemployment Correlation Summary
| Measurement | Delaware | Pueblo |
| Minimum | 0.50% | 1.3% |
| Maximum | 22.4% | 28.7% |
| Range | 21.9% | 27.4% |
| Mean | 5.8% | 8.2% |
| Median | 4.8% | 7.4% |
| Interquartile 25% (IQ1) | 3.3% | 5.0% |
| Interquartile 75% (IQ3) | 7.1% | 10.5% |
| Interquartile Range (IQR) | 3.8% | 5.5% |
| Standard Deviation (Sample) | 4.0% | 4.8% |
| Standard Deviation (Population) | 3.9% | 4.7% |
Similar Demographics by Female Unemployment
Demographics Similar to Delaware by Female Unemployment
In terms of female unemployment, the demographic groups most similar to Delaware are Nicaraguan (5.5%, a difference of 0.010%), Brazilian (5.5%, a difference of 0.030%), Iraqi (5.5%, a difference of 0.030%), French American Indian (5.5%, a difference of 0.25%), and Immigrants from Africa (5.4%, a difference of 0.27%).
| Demographics | Rating | Rank | Female Unemployment |
| Comanche | 10.0 /100 | #216 | Poor 5.4% |
| Peruvians | 9.6 /100 | #217 | Tragic 5.4% |
| Bermudans | 9.0 /100 | #218 | Tragic 5.4% |
| South Americans | 8.6 /100 | #219 | Tragic 5.4% |
| Immigrants | Africa | 8.5 /100 | #220 | Tragic 5.4% |
| Brazilians | 7.3 /100 | #221 | Tragic 5.5% |
| Nicaraguans | 7.2 /100 | #222 | Tragic 5.5% |
| Delaware | 7.2 /100 | #223 | Tragic 5.5% |
| Iraqis | 7.1 /100 | #224 | Tragic 5.5% |
| French American Indians | 6.1 /100 | #225 | Tragic 5.5% |
| Immigrants | Peru | 5.9 /100 | #226 | Tragic 5.5% |
| Immigrants | Philippines | 5.3 /100 | #227 | Tragic 5.5% |
| Israelis | 4.8 /100 | #228 | Tragic 5.5% |
| Panamanians | 4.7 /100 | #229 | Tragic 5.5% |
| Immigrants | Uruguay | 4.7 /100 | #230 | Tragic 5.5% |
Demographics Similar to Pueblo by Female Unemployment
In terms of female unemployment, the demographic groups most similar to Pueblo are Houma (6.4%, a difference of 0.29%), Immigrants from Ecuador (6.4%, a difference of 0.31%), Belizean (6.3%, a difference of 0.54%), Immigrants from Grenada (6.3%, a difference of 0.55%), and Immigrants from St. Vincent and the Grenadines (6.4%, a difference of 0.74%).
| Demographics | Rating | Rank | Female Unemployment |
| Hispanics or Latinos | 0.0 /100 | #308 | Tragic 6.2% |
| Ecuadorians | 0.0 /100 | #309 | Tragic 6.3% |
| Central American Indians | 0.0 /100 | #310 | Tragic 6.3% |
| Immigrants | Mexico | 0.0 /100 | #311 | Tragic 6.3% |
| Immigrants | Grenada | 0.0 /100 | #312 | Tragic 6.3% |
| Belizeans | 0.0 /100 | #313 | Tragic 6.3% |
| Immigrants | Ecuador | 0.0 /100 | #314 | Tragic 6.4% |
| Pueblo | 0.0 /100 | #315 | Tragic 6.4% |
| Houma | 0.0 /100 | #316 | Tragic 6.4% |
| Immigrants | St. Vincent and the Grenadines | 0.0 /100 | #317 | Tragic 6.4% |
| British West Indians | 0.0 /100 | #318 | Tragic 6.4% |
| Immigrants | Bangladesh | 0.0 /100 | #319 | Tragic 6.5% |
| Immigrants | Dominica | 0.0 /100 | #320 | Tragic 6.5% |
| Blacks/African Americans | 0.0 /100 | #321 | Tragic 6.5% |
| Vietnamese | 0.0 /100 | #322 | Tragic 6.5% |