Guyanese vs Ottawa Unemployment Among Ages 25 to 29 years
COMPARE
Guyanese
Ottawa
Unemployment Among Ages 25 to 29 years
Unemployment Among Ages 25 to 29 years Comparison
Guyanese
Ottawa
8.5%
UNEMPLOYMENT AMONG AGES 25 TO 29 YEARS
0.0/ 100
METRIC RATING
318th/ 347
METRIC RANK
7.3%
UNEMPLOYMENT AMONG AGES 25 TO 29 YEARS
0.1/ 100
METRIC RATING
258th/ 347
METRIC RANK
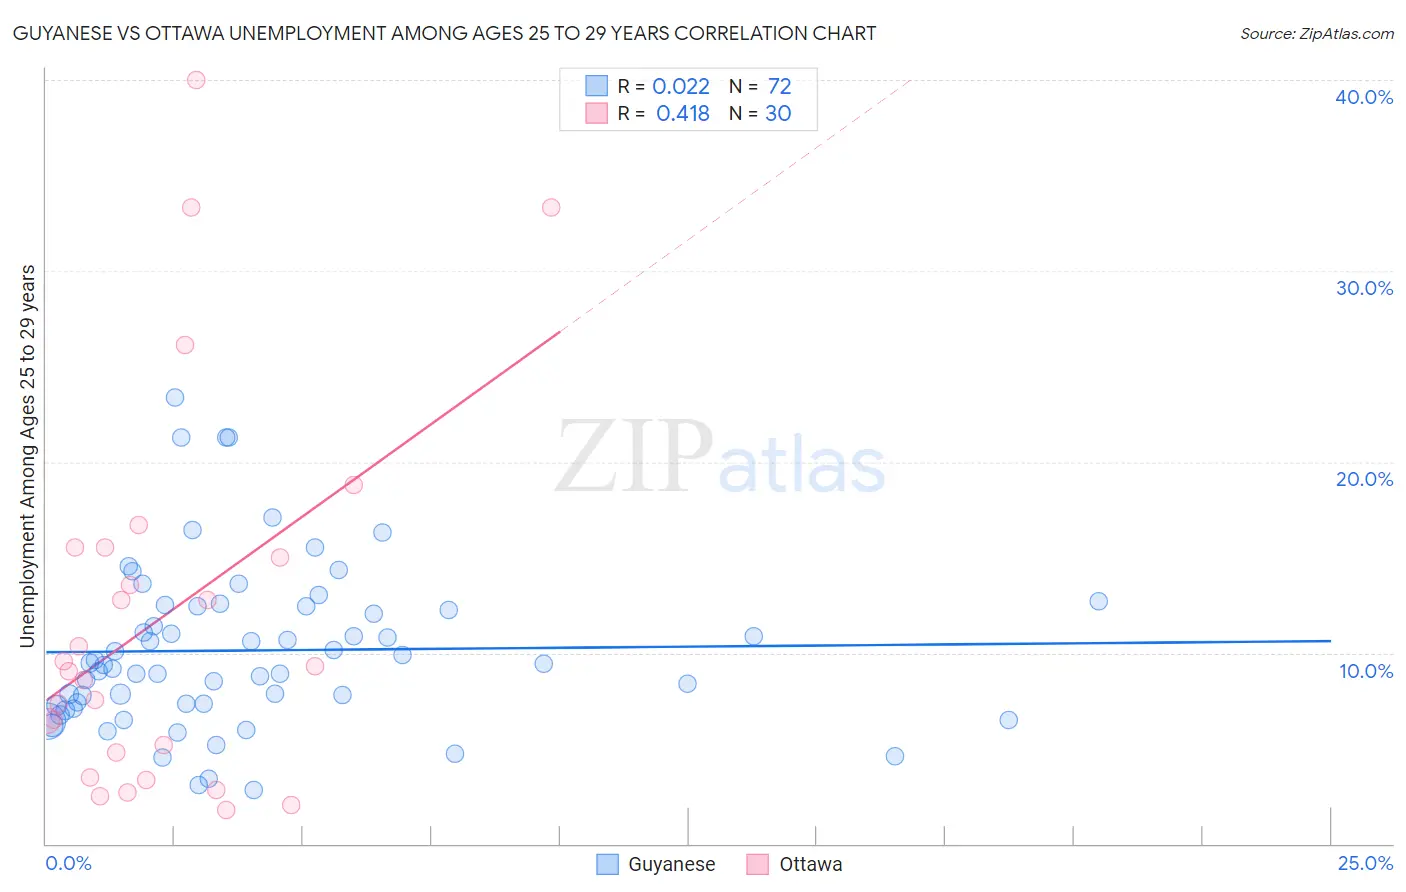
Guyanese vs Ottawa Unemployment Among Ages 25 to 29 years Correlation Chart
The statistical analysis conducted on geographies consisting of 172,955,672 people shows no correlation between the proportion of Guyanese and unemployment rate among population between the ages 25 and 29 in the United States with a correlation coefficient (R) of 0.022 and weighted average of 8.5%. Similarly, the statistical analysis conducted on geographies consisting of 48,962,303 people shows a moderate positive correlation between the proportion of Ottawa and unemployment rate among population between the ages 25 and 29 in the United States with a correlation coefficient (R) of 0.418 and weighted average of 7.3%, a difference of 15.9%.
Unemployment Among Ages 25 to 29 years Correlation Summary
| Measurement | Guyanese | Ottawa |
| Minimum | 2.8% | 1.8% |
| Maximum | 23.4% | 40.0% |
| Range | 20.6% | 38.2% |
| Mean | 10.1% | 11.9% |
| Median | 9.4% | 9.2% |
| Interquartile 25% (IQ1) | 7.3% | 4.8% |
| Interquartile 75% (IQ3) | 12.5% | 15.5% |
| Interquartile Range (IQR) | 5.2% | 10.8% |
| Standard Deviation (Sample) | 4.3% | 9.9% |
| Standard Deviation (Population) | 4.3% | 9.7% |
Similar Demographics by Unemployment Among Ages 25 to 29 years
Demographics Similar to Guyanese by Unemployment Among Ages 25 to 29 years
In terms of unemployment among ages 25 to 29 years, the demographic groups most similar to Guyanese are Immigrants from Armenia (8.5%, a difference of 0.23%), Immigrants from Guyana (8.5%, a difference of 0.26%), Immigrants from Grenada (8.4%, a difference of 0.35%), British West Indian (8.4%, a difference of 0.41%), and Black/African American (8.6%, a difference of 0.97%).
| Demographics | Rating | Rank | Unemployment Among Ages 25 to 29 years |
| Immigrants | Azores | 0.0 /100 | #311 | Tragic 8.1% |
| Dutch West Indians | 0.0 /100 | #312 | Tragic 8.2% |
| Immigrants | St. Vincent and the Grenadines | 0.0 /100 | #313 | Tragic 8.4% |
| Immigrants | Dominica | 0.0 /100 | #314 | Tragic 8.4% |
| British West Indians | 0.0 /100 | #315 | Tragic 8.4% |
| Immigrants | Grenada | 0.0 /100 | #316 | Tragic 8.4% |
| Immigrants | Guyana | 0.0 /100 | #317 | Tragic 8.5% |
| Guyanese | 0.0 /100 | #318 | Tragic 8.5% |
| Immigrants | Armenia | 0.0 /100 | #319 | Tragic 8.5% |
| Blacks/African Americans | 0.0 /100 | #320 | Tragic 8.6% |
| Immigrants | Dominican Republic | 0.0 /100 | #321 | Tragic 8.6% |
| Tlingit-Haida | 0.0 /100 | #322 | Tragic 8.7% |
| Dominicans | 0.0 /100 | #323 | Tragic 8.7% |
| Houma | 0.0 /100 | #324 | Tragic 8.7% |
| Yakama | 0.0 /100 | #325 | Tragic 8.8% |
Demographics Similar to Ottawa by Unemployment Among Ages 25 to 29 years
In terms of unemployment among ages 25 to 29 years, the demographic groups most similar to Ottawa are Cree (7.3%, a difference of 0.21%), Assyrian/Chaldean/Syriac (7.3%, a difference of 0.40%), American (7.4%, a difference of 0.74%), Mexican American Indian (7.3%, a difference of 0.77%), and Nigerian (7.4%, a difference of 0.82%).
| Demographics | Rating | Rank | Unemployment Among Ages 25 to 29 years |
| Portuguese | 0.5 /100 | #251 | Tragic 7.2% |
| Sierra Leoneans | 0.4 /100 | #252 | Tragic 7.2% |
| Immigrants | Portugal | 0.3 /100 | #253 | Tragic 7.2% |
| Ghanaians | 0.3 /100 | #254 | Tragic 7.2% |
| Immigrants | Cameroon | 0.3 /100 | #255 | Tragic 7.2% |
| Mexican American Indians | 0.3 /100 | #256 | Tragic 7.3% |
| Assyrians/Chaldeans/Syriacs | 0.2 /100 | #257 | Tragic 7.3% |
| Ottawa | 0.1 /100 | #258 | Tragic 7.3% |
| Cree | 0.1 /100 | #259 | Tragic 7.3% |
| Americans | 0.1 /100 | #260 | Tragic 7.4% |
| Nigerians | 0.1 /100 | #261 | Tragic 7.4% |
| Ecuadorians | 0.1 /100 | #262 | Tragic 7.4% |
| Kiowa | 0.1 /100 | #263 | Tragic 7.4% |
| Immigrants | Western Africa | 0.1 /100 | #264 | Tragic 7.4% |
| Immigrants | Fiji | 0.1 /100 | #265 | Tragic 7.4% |