Choctaw vs Ottawa Unemployment Among Ages 25 to 29 years
COMPARE
Choctaw
Ottawa
Unemployment Among Ages 25 to 29 years
Unemployment Among Ages 25 to 29 years Comparison
Choctaw
Ottawa
7.5%
UNEMPLOYMENT AMONG AGES 25 TO 29 YEARS
0.0/ 100
METRIC RATING
271st/ 347
METRIC RANK
7.3%
UNEMPLOYMENT AMONG AGES 25 TO 29 YEARS
0.1/ 100
METRIC RATING
258th/ 347
METRIC RANK
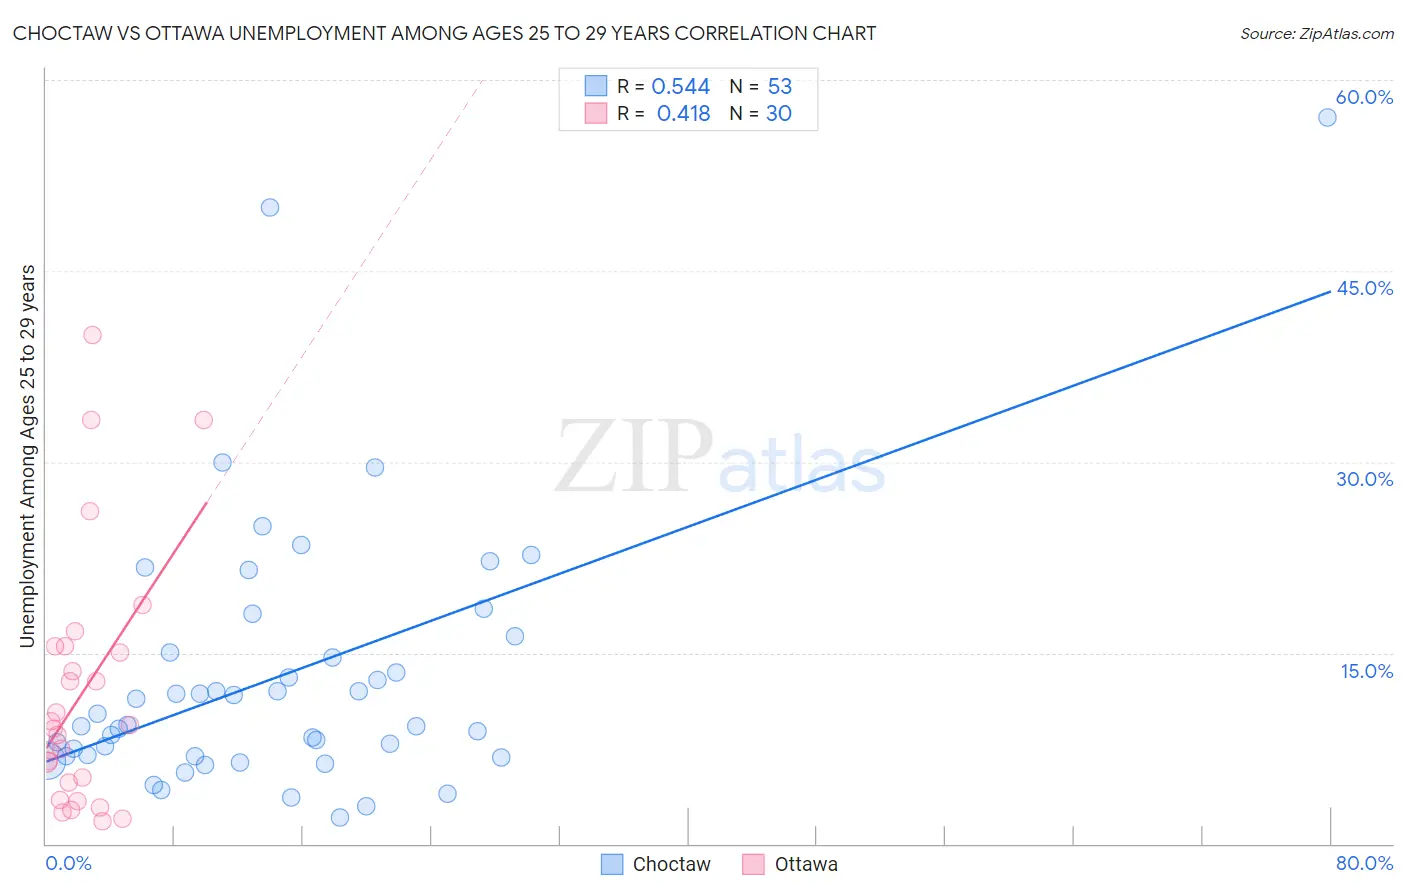
Choctaw vs Ottawa Unemployment Among Ages 25 to 29 years Correlation Chart
The statistical analysis conducted on geographies consisting of 259,814,267 people shows a substantial positive correlation between the proportion of Choctaw and unemployment rate among population between the ages 25 and 29 in the United States with a correlation coefficient (R) of 0.544 and weighted average of 7.5%. Similarly, the statistical analysis conducted on geographies consisting of 48,962,303 people shows a moderate positive correlation between the proportion of Ottawa and unemployment rate among population between the ages 25 and 29 in the United States with a correlation coefficient (R) of 0.418 and weighted average of 7.3%, a difference of 1.9%.
Unemployment Among Ages 25 to 29 years Correlation Summary
| Measurement | Choctaw | Ottawa |
| Minimum | 2.1% | 1.8% |
| Maximum | 57.1% | 40.0% |
| Range | 55.0% | 38.2% |
| Mean | 13.2% | 11.9% |
| Median | 9.3% | 9.2% |
| Interquartile 25% (IQ1) | 6.9% | 4.8% |
| Interquartile 75% (IQ3) | 15.7% | 15.5% |
| Interquartile Range (IQR) | 8.8% | 10.8% |
| Standard Deviation (Sample) | 10.5% | 9.9% |
| Standard Deviation (Population) | 10.4% | 9.7% |
Demographics Similar to Choctaw and Ottawa by Unemployment Among Ages 25 to 29 years
In terms of unemployment among ages 25 to 29 years, the demographic groups most similar to Choctaw are Bahamian (7.5%, a difference of 0.020%), Immigrants from Bahamas (7.5%, a difference of 0.060%), Immigrants from Nigeria (7.5%, a difference of 0.080%), Immigrants from Central America (7.5%, a difference of 0.29%), and Immigrants from Latin America (7.4%, a difference of 0.53%). Similarly, the demographic groups most similar to Ottawa are Cree (7.3%, a difference of 0.21%), Assyrian/Chaldean/Syriac (7.3%, a difference of 0.40%), American (7.4%, a difference of 0.74%), Mexican American Indian (7.3%, a difference of 0.77%), and Nigerian (7.4%, a difference of 0.82%).
| Demographics | Rating | Rank | Unemployment Among Ages 25 to 29 years |
| Ghanaians | 0.3 /100 | #254 | Tragic 7.2% |
| Immigrants | Cameroon | 0.3 /100 | #255 | Tragic 7.2% |
| Mexican American Indians | 0.3 /100 | #256 | Tragic 7.3% |
| Assyrians/Chaldeans/Syriacs | 0.2 /100 | #257 | Tragic 7.3% |
| Ottawa | 0.1 /100 | #258 | Tragic 7.3% |
| Cree | 0.1 /100 | #259 | Tragic 7.3% |
| Americans | 0.1 /100 | #260 | Tragic 7.4% |
| Nigerians | 0.1 /100 | #261 | Tragic 7.4% |
| Ecuadorians | 0.1 /100 | #262 | Tragic 7.4% |
| Kiowa | 0.1 /100 | #263 | Tragic 7.4% |
| Immigrants | Western Africa | 0.1 /100 | #264 | Tragic 7.4% |
| Immigrants | Fiji | 0.1 /100 | #265 | Tragic 7.4% |
| Paiute | 0.1 /100 | #266 | Tragic 7.4% |
| Pennsylvania Germans | 0.1 /100 | #267 | Tragic 7.4% |
| Immigrants | Ecuador | 0.1 /100 | #268 | Tragic 7.4% |
| Immigrants | Latin America | 0.1 /100 | #269 | Tragic 7.4% |
| Bahamians | 0.0 /100 | #270 | Tragic 7.5% |
| Choctaw | 0.0 /100 | #271 | Tragic 7.5% |
| Immigrants | Bahamas | 0.0 /100 | #272 | Tragic 7.5% |
| Immigrants | Nigeria | 0.0 /100 | #273 | Tragic 7.5% |
| Immigrants | Central America | 0.0 /100 | #274 | Tragic 7.5% |