Menominee vs Ottawa Unemployment Among Ages 25 to 29 years
COMPARE
Menominee
Ottawa
Unemployment Among Ages 25 to 29 years
Unemployment Among Ages 25 to 29 years Comparison
Menominee
Ottawa
11.3%
UNEMPLOYMENT AMONG AGES 25 TO 29 YEARS
0.0/ 100
METRIC RATING
337th/ 347
METRIC RANK
7.3%
UNEMPLOYMENT AMONG AGES 25 TO 29 YEARS
0.1/ 100
METRIC RATING
258th/ 347
METRIC RANK
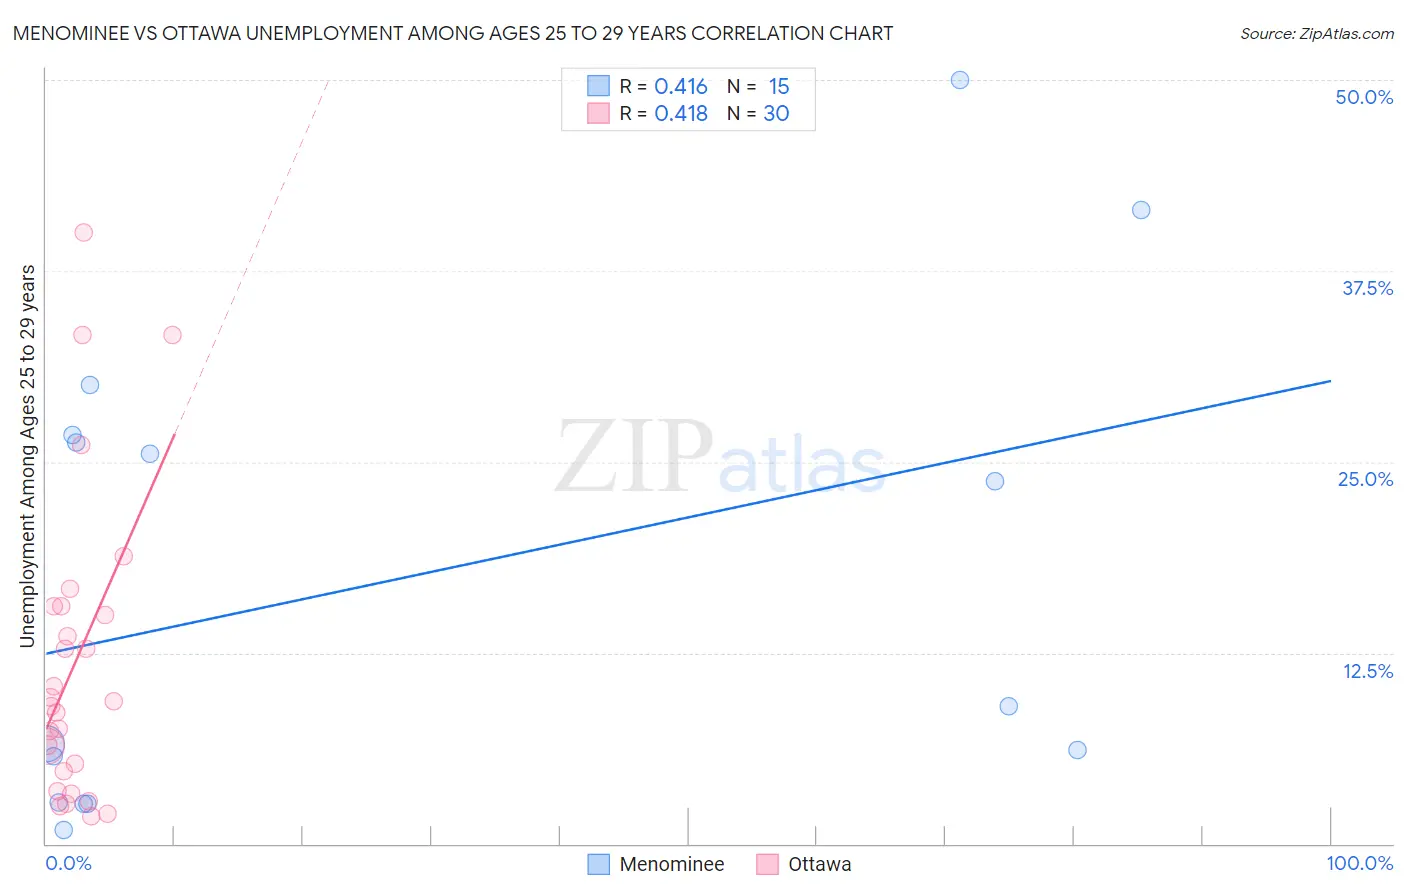
Menominee vs Ottawa Unemployment Among Ages 25 to 29 years Correlation Chart
The statistical analysis conducted on geographies consisting of 44,934,192 people shows a moderate positive correlation between the proportion of Menominee and unemployment rate among population between the ages 25 and 29 in the United States with a correlation coefficient (R) of 0.416 and weighted average of 11.3%. Similarly, the statistical analysis conducted on geographies consisting of 48,962,303 people shows a moderate positive correlation between the proportion of Ottawa and unemployment rate among population between the ages 25 and 29 in the United States with a correlation coefficient (R) of 0.418 and weighted average of 7.3%, a difference of 54.0%.
Unemployment Among Ages 25 to 29 years Correlation Summary
| Measurement | Menominee | Ottawa |
| Minimum | 0.91% | 1.8% |
| Maximum | 50.0% | 40.0% |
| Range | 49.1% | 38.2% |
| Mean | 17.3% | 11.9% |
| Median | 9.0% | 9.2% |
| Interquartile 25% (IQ1) | 2.7% | 4.8% |
| Interquartile 75% (IQ3) | 26.8% | 15.5% |
| Interquartile Range (IQR) | 24.1% | 10.8% |
| Standard Deviation (Sample) | 15.7% | 9.9% |
| Standard Deviation (Population) | 15.2% | 9.7% |
Similar Demographics by Unemployment Among Ages 25 to 29 years
Demographics Similar to Menominee by Unemployment Among Ages 25 to 29 years
In terms of unemployment among ages 25 to 29 years, the demographic groups most similar to Menominee are Lumbee (11.2%, a difference of 0.28%), Puerto Rican (11.1%, a difference of 1.3%), Yuman (11.0%, a difference of 2.5%), Sioux (11.7%, a difference of 3.5%), and Pima (11.8%, a difference of 4.5%).
| Demographics | Rating | Rank | Unemployment Among Ages 25 to 29 years |
| Natives/Alaskans | 0.0 /100 | #330 | Tragic 9.8% |
| Alaska Natives | 0.0 /100 | #331 | Tragic 10.2% |
| Pueblo | 0.0 /100 | #332 | Tragic 10.4% |
| Alaskan Athabascans | 0.0 /100 | #333 | Tragic 10.8% |
| Yuman | 0.0 /100 | #334 | Tragic 11.0% |
| Puerto Ricans | 0.0 /100 | #335 | Tragic 11.1% |
| Lumbee | 0.0 /100 | #336 | Tragic 11.2% |
| Menominee | 0.0 /100 | #337 | Tragic 11.3% |
| Sioux | 0.0 /100 | #338 | Tragic 11.7% |
| Pima | 0.0 /100 | #339 | Tragic 11.8% |
| Cheyenne | 0.0 /100 | #340 | Tragic 11.8% |
| Tohono O'odham | 0.0 /100 | #341 | Tragic 12.1% |
| Navajo | 0.0 /100 | #342 | Tragic 12.2% |
| Inupiat | 0.0 /100 | #343 | Tragic 13.4% |
| Hopi | 0.0 /100 | #344 | Tragic 13.5% |
Demographics Similar to Ottawa by Unemployment Among Ages 25 to 29 years
In terms of unemployment among ages 25 to 29 years, the demographic groups most similar to Ottawa are Cree (7.3%, a difference of 0.21%), Assyrian/Chaldean/Syriac (7.3%, a difference of 0.40%), American (7.4%, a difference of 0.74%), Mexican American Indian (7.3%, a difference of 0.77%), and Nigerian (7.4%, a difference of 0.82%).
| Demographics | Rating | Rank | Unemployment Among Ages 25 to 29 years |
| Portuguese | 0.5 /100 | #251 | Tragic 7.2% |
| Sierra Leoneans | 0.4 /100 | #252 | Tragic 7.2% |
| Immigrants | Portugal | 0.3 /100 | #253 | Tragic 7.2% |
| Ghanaians | 0.3 /100 | #254 | Tragic 7.2% |
| Immigrants | Cameroon | 0.3 /100 | #255 | Tragic 7.2% |
| Mexican American Indians | 0.3 /100 | #256 | Tragic 7.3% |
| Assyrians/Chaldeans/Syriacs | 0.2 /100 | #257 | Tragic 7.3% |
| Ottawa | 0.1 /100 | #258 | Tragic 7.3% |
| Cree | 0.1 /100 | #259 | Tragic 7.3% |
| Americans | 0.1 /100 | #260 | Tragic 7.4% |
| Nigerians | 0.1 /100 | #261 | Tragic 7.4% |
| Ecuadorians | 0.1 /100 | #262 | Tragic 7.4% |
| Kiowa | 0.1 /100 | #263 | Tragic 7.4% |
| Immigrants | Western Africa | 0.1 /100 | #264 | Tragic 7.4% |
| Immigrants | Fiji | 0.1 /100 | #265 | Tragic 7.4% |