Immigrants from North Macedonia vs Ottawa Unemployment Among Ages 25 to 29 years
COMPARE
Immigrants from North Macedonia
Ottawa
Unemployment Among Ages 25 to 29 years
Unemployment Among Ages 25 to 29 years Comparison
Immigrants from North Macedonia
Ottawa
6.4%
UNEMPLOYMENT AMONG AGES 25 TO 29 YEARS
93.6/ 100
METRIC RATING
92nd/ 347
METRIC RANK
7.3%
UNEMPLOYMENT AMONG AGES 25 TO 29 YEARS
0.1/ 100
METRIC RATING
258th/ 347
METRIC RANK
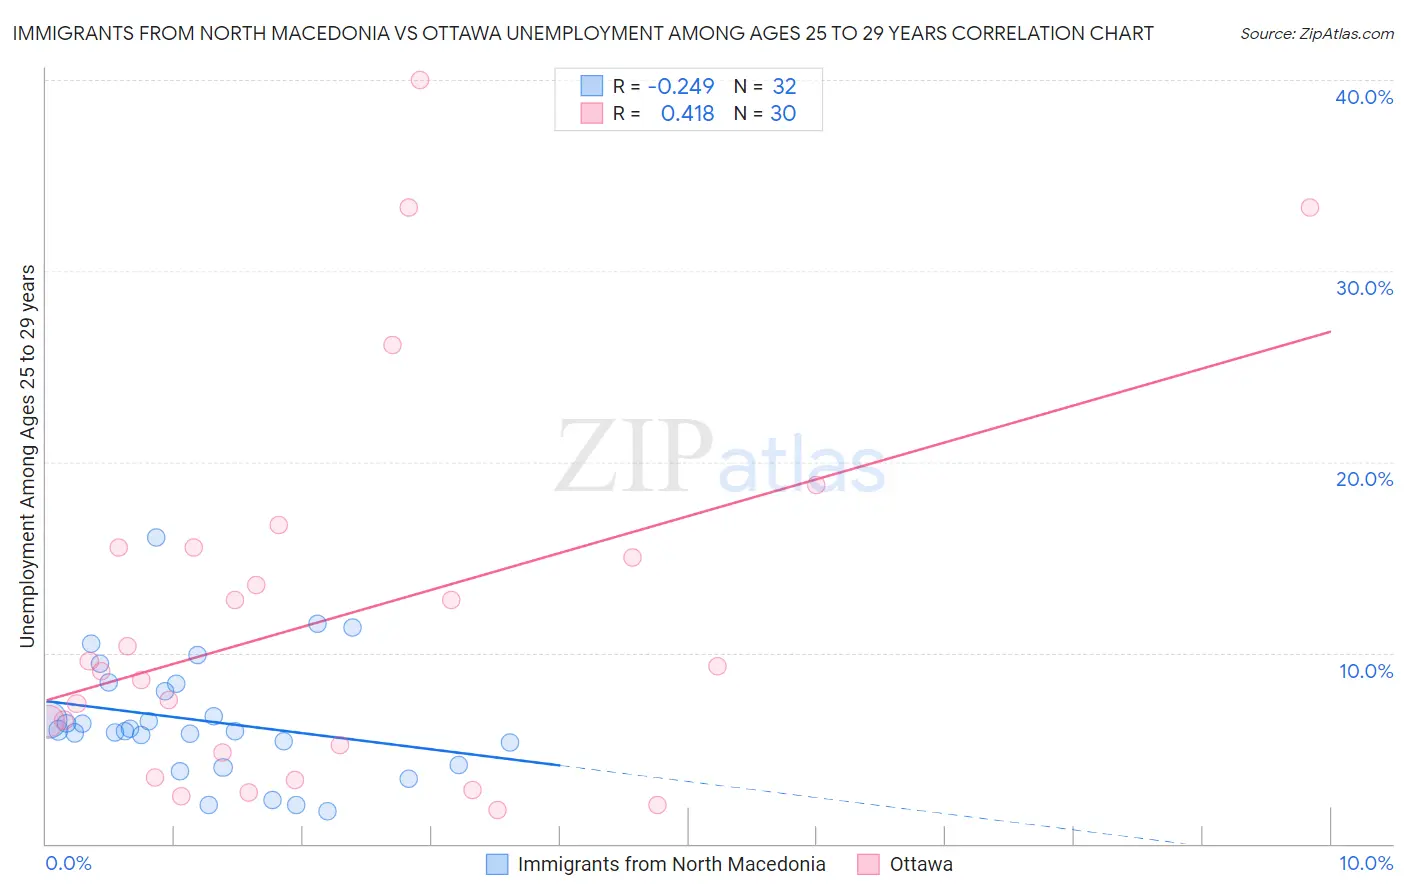
Immigrants from North Macedonia vs Ottawa Unemployment Among Ages 25 to 29 years Correlation Chart
The statistical analysis conducted on geographies consisting of 72,870,541 people shows a weak negative correlation between the proportion of Immigrants from North Macedonia and unemployment rate among population between the ages 25 and 29 in the United States with a correlation coefficient (R) of -0.249 and weighted average of 6.4%. Similarly, the statistical analysis conducted on geographies consisting of 48,962,303 people shows a moderate positive correlation between the proportion of Ottawa and unemployment rate among population between the ages 25 and 29 in the United States with a correlation coefficient (R) of 0.418 and weighted average of 7.3%, a difference of 14.8%.
Unemployment Among Ages 25 to 29 years Correlation Summary
| Measurement | Immigrants from North Macedonia | Ottawa |
| Minimum | 1.7% | 1.8% |
| Maximum | 16.1% | 40.0% |
| Range | 14.4% | 38.2% |
| Mean | 6.5% | 11.9% |
| Median | 5.9% | 9.2% |
| Interquartile 25% (IQ1) | 4.7% | 4.8% |
| Interquartile 75% (IQ3) | 8.2% | 15.5% |
| Interquartile Range (IQR) | 3.5% | 10.8% |
| Standard Deviation (Sample) | 3.1% | 9.9% |
| Standard Deviation (Population) | 3.1% | 9.7% |
Similar Demographics by Unemployment Among Ages 25 to 29 years
Demographics Similar to Immigrants from North Macedonia by Unemployment Among Ages 25 to 29 years
In terms of unemployment among ages 25 to 29 years, the demographic groups most similar to Immigrants from North Macedonia are Australian (6.4%, a difference of 0.0%), Zimbabwean (6.4%, a difference of 0.050%), Egyptian (6.4%, a difference of 0.060%), Lebanese (6.4%, a difference of 0.070%), and Immigrants from Oceania (6.4%, a difference of 0.14%).
| Demographics | Rating | Rank | Unemployment Among Ages 25 to 29 years |
| Immigrants | Sweden | 95.1 /100 | #85 | Exceptional 6.3% |
| Immigrants | Asia | 94.9 /100 | #86 | Exceptional 6.3% |
| Marshallese | 94.7 /100 | #87 | Exceptional 6.4% |
| Immigrants | Indonesia | 94.5 /100 | #88 | Exceptional 6.4% |
| Immigrants | Oceania | 94.1 /100 | #89 | Exceptional 6.4% |
| Lebanese | 93.9 /100 | #90 | Exceptional 6.4% |
| Egyptians | 93.9 /100 | #91 | Exceptional 6.4% |
| Immigrants | North Macedonia | 93.6 /100 | #92 | Exceptional 6.4% |
| Australians | 93.6 /100 | #93 | Exceptional 6.4% |
| Zimbabweans | 93.5 /100 | #94 | Exceptional 6.4% |
| Afghans | 92.5 /100 | #95 | Exceptional 6.4% |
| Immigrants | Brazil | 92.1 /100 | #96 | Exceptional 6.4% |
| Immigrants | Eastern Europe | 91.9 /100 | #97 | Exceptional 6.4% |
| Serbians | 91.7 /100 | #98 | Exceptional 6.4% |
| Iraqis | 91.3 /100 | #99 | Exceptional 6.4% |
Demographics Similar to Ottawa by Unemployment Among Ages 25 to 29 years
In terms of unemployment among ages 25 to 29 years, the demographic groups most similar to Ottawa are Cree (7.3%, a difference of 0.21%), Assyrian/Chaldean/Syriac (7.3%, a difference of 0.40%), American (7.4%, a difference of 0.74%), Mexican American Indian (7.3%, a difference of 0.77%), and Nigerian (7.4%, a difference of 0.82%).
| Demographics | Rating | Rank | Unemployment Among Ages 25 to 29 years |
| Portuguese | 0.5 /100 | #251 | Tragic 7.2% |
| Sierra Leoneans | 0.4 /100 | #252 | Tragic 7.2% |
| Immigrants | Portugal | 0.3 /100 | #253 | Tragic 7.2% |
| Ghanaians | 0.3 /100 | #254 | Tragic 7.2% |
| Immigrants | Cameroon | 0.3 /100 | #255 | Tragic 7.2% |
| Mexican American Indians | 0.3 /100 | #256 | Tragic 7.3% |
| Assyrians/Chaldeans/Syriacs | 0.2 /100 | #257 | Tragic 7.3% |
| Ottawa | 0.1 /100 | #258 | Tragic 7.3% |
| Cree | 0.1 /100 | #259 | Tragic 7.3% |
| Americans | 0.1 /100 | #260 | Tragic 7.4% |
| Nigerians | 0.1 /100 | #261 | Tragic 7.4% |
| Ecuadorians | 0.1 /100 | #262 | Tragic 7.4% |
| Kiowa | 0.1 /100 | #263 | Tragic 7.4% |
| Immigrants | Western Africa | 0.1 /100 | #264 | Tragic 7.4% |
| Immigrants | Fiji | 0.1 /100 | #265 | Tragic 7.4% |