Guyanese vs Ottawa Unemployment Among Ages 20 to 24 years
COMPARE
Guyanese
Ottawa
Unemployment Among Ages 20 to 24 years
Unemployment Among Ages 20 to 24 years Comparison
Guyanese
Ottawa
14.0%
UNEMPLOYMENT AMONG AGES 20 TO 24 YEARS
0.0/ 100
METRIC RATING
334th/ 347
METRIC RANK
10.1%
UNEMPLOYMENT AMONG AGES 20 TO 24 YEARS
90.8/ 100
METRIC RATING
114th/ 347
METRIC RANK
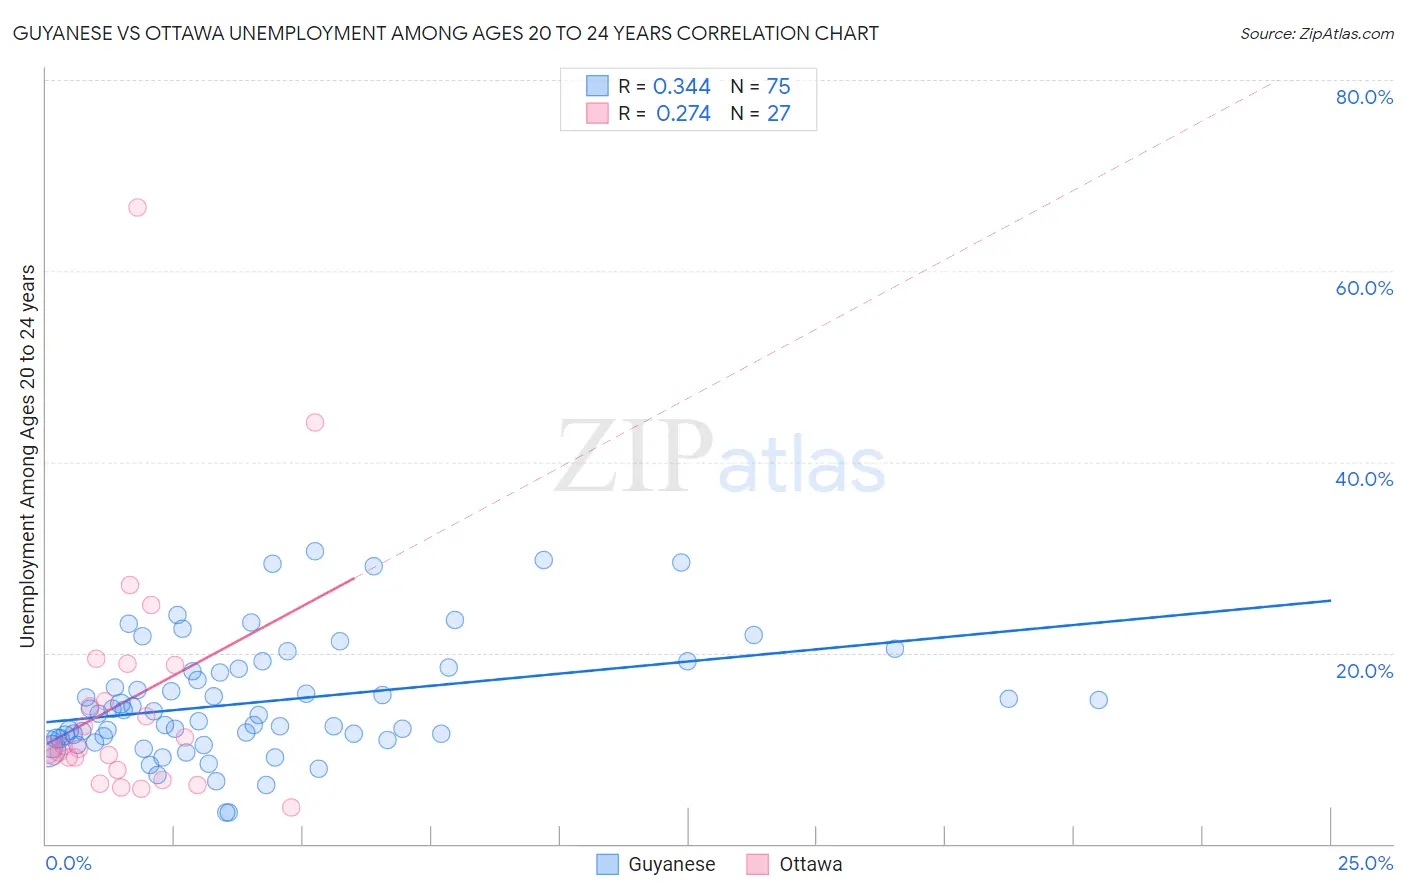
Guyanese vs Ottawa Unemployment Among Ages 20 to 24 years Correlation Chart
The statistical analysis conducted on geographies consisting of 175,080,797 people shows a mild positive correlation between the proportion of Guyanese and unemployment rate among population between the ages 20 and 24 in the United States with a correlation coefficient (R) of 0.344 and weighted average of 14.0%. Similarly, the statistical analysis conducted on geographies consisting of 49,196,641 people shows a weak positive correlation between the proportion of Ottawa and unemployment rate among population between the ages 20 and 24 in the United States with a correlation coefficient (R) of 0.274 and weighted average of 10.1%, a difference of 38.6%.
Unemployment Among Ages 20 to 24 years Correlation Summary
| Measurement | Guyanese | Ottawa |
| Minimum | 3.3% | 3.8% |
| Maximum | 30.6% | 66.7% |
| Range | 27.3% | 62.9% |
| Mean | 14.9% | 15.0% |
| Median | 13.6% | 9.9% |
| Interquartile 25% (IQ1) | 11.0% | 7.8% |
| Interquartile 75% (IQ3) | 18.4% | 18.7% |
| Interquartile Range (IQR) | 7.4% | 10.9% |
| Standard Deviation (Sample) | 6.1% | 13.4% |
| Standard Deviation (Population) | 6.1% | 13.1% |
Similar Demographics by Unemployment Among Ages 20 to 24 years
Demographics Similar to Guyanese by Unemployment Among Ages 20 to 24 years
In terms of unemployment among ages 20 to 24 years, the demographic groups most similar to Guyanese are Immigrants from Guyana (13.9%, a difference of 0.50%), Immigrants from Grenada (13.8%, a difference of 1.0%), Aleut (13.8%, a difference of 1.1%), Sioux (14.2%, a difference of 1.2%), and Arapaho (13.8%, a difference of 1.3%).
| Demographics | Rating | Rank | Unemployment Among Ages 20 to 24 years |
| Immigrants | Dominican Republic | 0.0 /100 | #327 | Tragic 13.6% |
| British West Indians | 0.0 /100 | #328 | Tragic 13.7% |
| Dominicans | 0.0 /100 | #329 | Tragic 13.8% |
| Arapaho | 0.0 /100 | #330 | Tragic 13.8% |
| Aleuts | 0.0 /100 | #331 | Tragic 13.8% |
| Immigrants | Grenada | 0.0 /100 | #332 | Tragic 13.8% |
| Immigrants | Guyana | 0.0 /100 | #333 | Tragic 13.9% |
| Guyanese | 0.0 /100 | #334 | Tragic 14.0% |
| Sioux | 0.0 /100 | #335 | Tragic 14.2% |
| Pima | 0.0 /100 | #336 | Tragic 14.2% |
| Paiute | 0.0 /100 | #337 | Tragic 14.3% |
| Immigrants | St. Vincent and the Grenadines | 0.0 /100 | #338 | Tragic 14.3% |
| Immigrants | Yemen | 0.0 /100 | #339 | Tragic 14.9% |
| Yuman | 0.0 /100 | #340 | Tragic 15.8% |
| Navajo | 0.0 /100 | #341 | Tragic 16.1% |
Demographics Similar to Ottawa by Unemployment Among Ages 20 to 24 years
In terms of unemployment among ages 20 to 24 years, the demographic groups most similar to Ottawa are Immigrants from Morocco (10.1%, a difference of 0.040%), Basque (10.1%, a difference of 0.12%), Immigrants from Uruguay (10.1%, a difference of 0.13%), German Russian (10.1%, a difference of 0.20%), and Immigrants from Indonesia (10.1%, a difference of 0.23%).
| Demographics | Rating | Rank | Unemployment Among Ages 20 to 24 years |
| Iroquois | 93.4 /100 | #107 | Exceptional 10.1% |
| Immigrants | Latvia | 93.2 /100 | #108 | Exceptional 10.1% |
| Filipinos | 93.2 /100 | #109 | Exceptional 10.1% |
| Immigrants | Spain | 93.1 /100 | #110 | Exceptional 10.1% |
| Immigrants | Indonesia | 92.7 /100 | #111 | Exceptional 10.1% |
| Northern Europeans | 92.7 /100 | #112 | Exceptional 10.1% |
| German Russians | 92.4 /100 | #113 | Exceptional 10.1% |
| Ottawa | 90.8 /100 | #114 | Exceptional 10.1% |
| Immigrants | Morocco | 90.5 /100 | #115 | Exceptional 10.1% |
| Basques | 89.8 /100 | #116 | Excellent 10.1% |
| Immigrants | Uruguay | 89.6 /100 | #117 | Excellent 10.1% |
| Paraguayans | 88.6 /100 | #118 | Excellent 10.1% |
| French | 88.2 /100 | #119 | Excellent 10.1% |
| Immigrants | Canada | 88.2 /100 | #120 | Excellent 10.1% |
| South Africans | 87.8 /100 | #121 | Excellent 10.1% |