Guyanese vs Ottawa Median Family Income
COMPARE
Guyanese
Ottawa
Median Family Income
Median Family Income Comparison
Guyanese
Ottawa
$93,373
MEDIAN FAMILY INCOME
0.9/ 100
METRIC RATING
246th/ 347
METRIC RANK
$86,380
MEDIAN FAMILY INCOME
0.0/ 100
METRIC RATING
300th/ 347
METRIC RANK
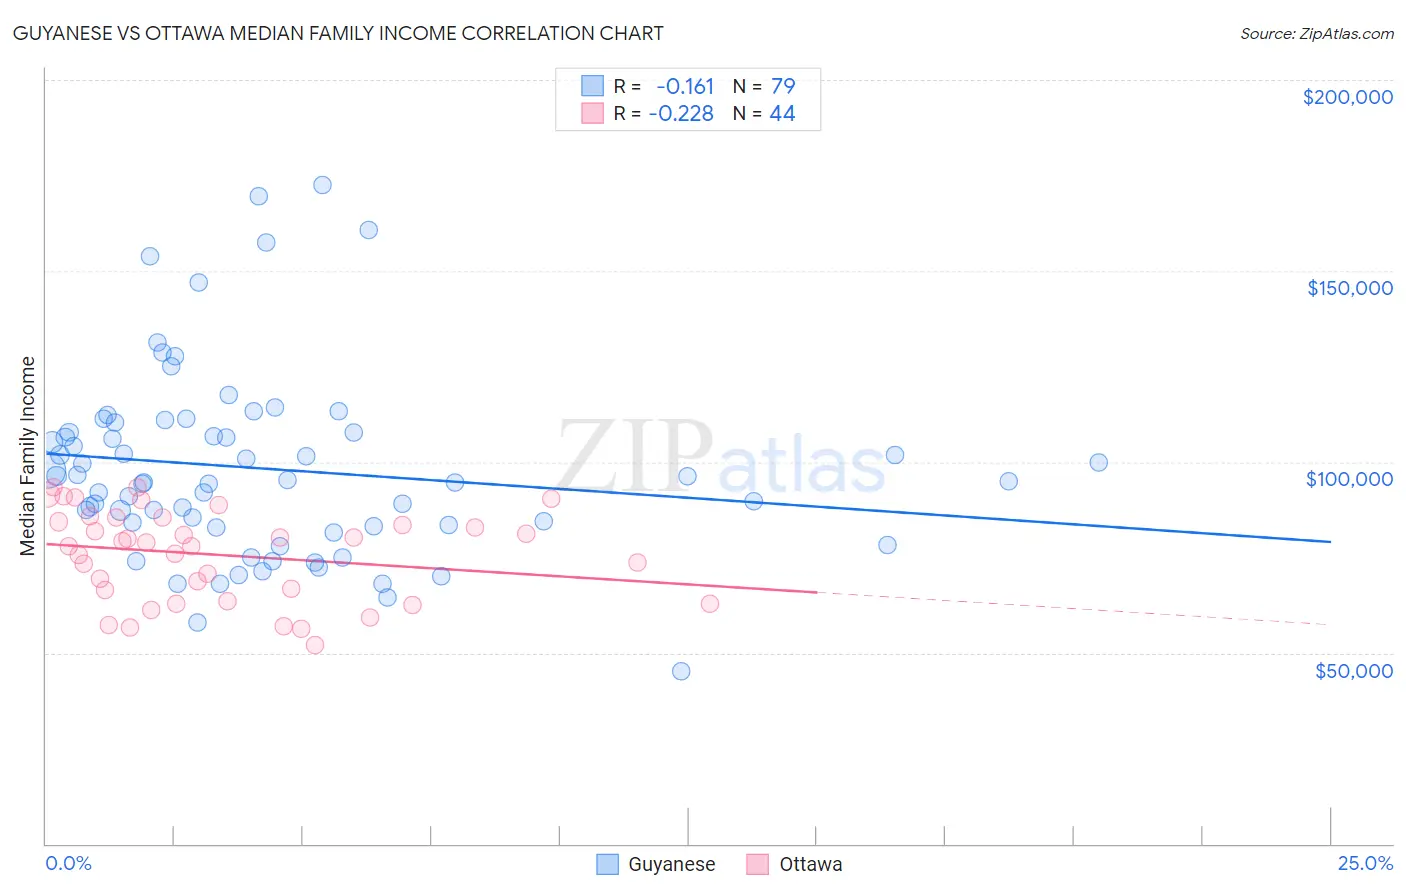
Guyanese vs Ottawa Median Family Income Correlation Chart
The statistical analysis conducted on geographies consisting of 176,743,960 people shows a poor negative correlation between the proportion of Guyanese and median family income in the United States with a correlation coefficient (R) of -0.161 and weighted average of $93,373. Similarly, the statistical analysis conducted on geographies consisting of 49,943,189 people shows a weak negative correlation between the proportion of Ottawa and median family income in the United States with a correlation coefficient (R) of -0.228 and weighted average of $86,380, a difference of 8.1%.
Median Family Income Correlation Summary
| Measurement | Guyanese | Ottawa |
| Minimum | $45,100 | $52,125 |
| Maximum | $172,597 | $93,380 |
| Range | $127,497 | $41,255 |
| Mean | $98,114 | $75,597 |
| Median | $94,843 | $78,416 |
| Interquartile 25% (IQ1) | $83,119 | $64,972 |
| Interquartile 75% (IQ3) | $107,693 | $84,864 |
| Interquartile Range (IQR) | $24,574 | $19,892 |
| Standard Deviation (Sample) | $24,573 | $11,825 |
| Standard Deviation (Population) | $24,417 | $11,690 |
Similar Demographics by Median Family Income
Demographics Similar to Guyanese by Median Family Income
In terms of median family income, the demographic groups most similar to Guyanese are Immigrants from Middle Africa ($93,593, a difference of 0.23%), Subsaharan African ($93,748, a difference of 0.40%), Immigrants from Senegal ($92,912, a difference of 0.50%), German Russian ($93,858, a difference of 0.52%), and French American Indian ($92,872, a difference of 0.54%).
| Demographics | Rating | Rank | Median Family Income |
| Salvadorans | 1.2 /100 | #239 | Tragic $94,109 |
| Somalis | 1.2 /100 | #240 | Tragic $94,085 |
| Immigrants | Trinidad and Tobago | 1.2 /100 | #241 | Tragic $93,988 |
| Barbadians | 1.1 /100 | #242 | Tragic $93,919 |
| German Russians | 1.1 /100 | #243 | Tragic $93,858 |
| Sub-Saharan Africans | 1.0 /100 | #244 | Tragic $93,748 |
| Immigrants | Middle Africa | 1.0 /100 | #245 | Tragic $93,593 |
| Guyanese | 0.9 /100 | #246 | Tragic $93,373 |
| Immigrants | Senegal | 0.7 /100 | #247 | Tragic $92,912 |
| French American Indians | 0.7 /100 | #248 | Tragic $92,872 |
| Immigrants | Ecuador | 0.7 /100 | #249 | Tragic $92,837 |
| West Indians | 0.6 /100 | #250 | Tragic $92,765 |
| Immigrants | Somalia | 0.6 /100 | #251 | Tragic $92,609 |
| Immigrants | El Salvador | 0.6 /100 | #252 | Tragic $92,545 |
| Immigrants | Guyana | 0.6 /100 | #253 | Tragic $92,513 |
Demographics Similar to Ottawa by Median Family Income
In terms of median family income, the demographic groups most similar to Ottawa are Chippewa ($86,852, a difference of 0.55%), Colville ($85,792, a difference of 0.69%), Immigrants from Latin America ($86,989, a difference of 0.71%), Spanish American Indian ($85,728, a difference of 0.76%), and Hispanic or Latino ($85,647, a difference of 0.86%).
| Demographics | Rating | Rank | Median Family Income |
| Ute | 0.0 /100 | #293 | Tragic $87,596 |
| Fijians | 0.0 /100 | #294 | Tragic $87,387 |
| Yaqui | 0.0 /100 | #295 | Tragic $87,289 |
| Immigrants | Guatemala | 0.0 /100 | #296 | Tragic $87,191 |
| Cajuns | 0.0 /100 | #297 | Tragic $87,157 |
| Immigrants | Latin America | 0.0 /100 | #298 | Tragic $86,989 |
| Chippewa | 0.0 /100 | #299 | Tragic $86,852 |
| Ottawa | 0.0 /100 | #300 | Tragic $86,380 |
| Colville | 0.0 /100 | #301 | Tragic $85,792 |
| Spanish American Indians | 0.0 /100 | #302 | Tragic $85,728 |
| Hispanics or Latinos | 0.0 /100 | #303 | Tragic $85,647 |
| Mexicans | 0.0 /100 | #304 | Tragic $85,618 |
| Paiute | 0.0 /100 | #305 | Tragic $85,414 |
| Immigrants | Dominica | 0.0 /100 | #306 | Tragic $85,411 |
| Chickasaw | 0.0 /100 | #307 | Tragic $85,356 |