Assyrian/Chaldean/Syriac vs Zimbabwean Unemployment Among Seniors over 75 years
COMPARE
Assyrian/Chaldean/Syriac
Zimbabwean
Unemployment Among Seniors over 75 years
Unemployment Among Seniors over 75 years Comparison
Assyrians/Chaldeans/Syriacs
Zimbabweans
11.1%
UNEMPLOYMENT AMONG SENIORS OVER 75 YEARS
0.0/ 100
METRIC RATING
334th/ 347
METRIC RANK
8.7%
UNEMPLOYMENT AMONG SENIORS OVER 75 YEARS
54.1/ 100
METRIC RATING
170th/ 347
METRIC RANK
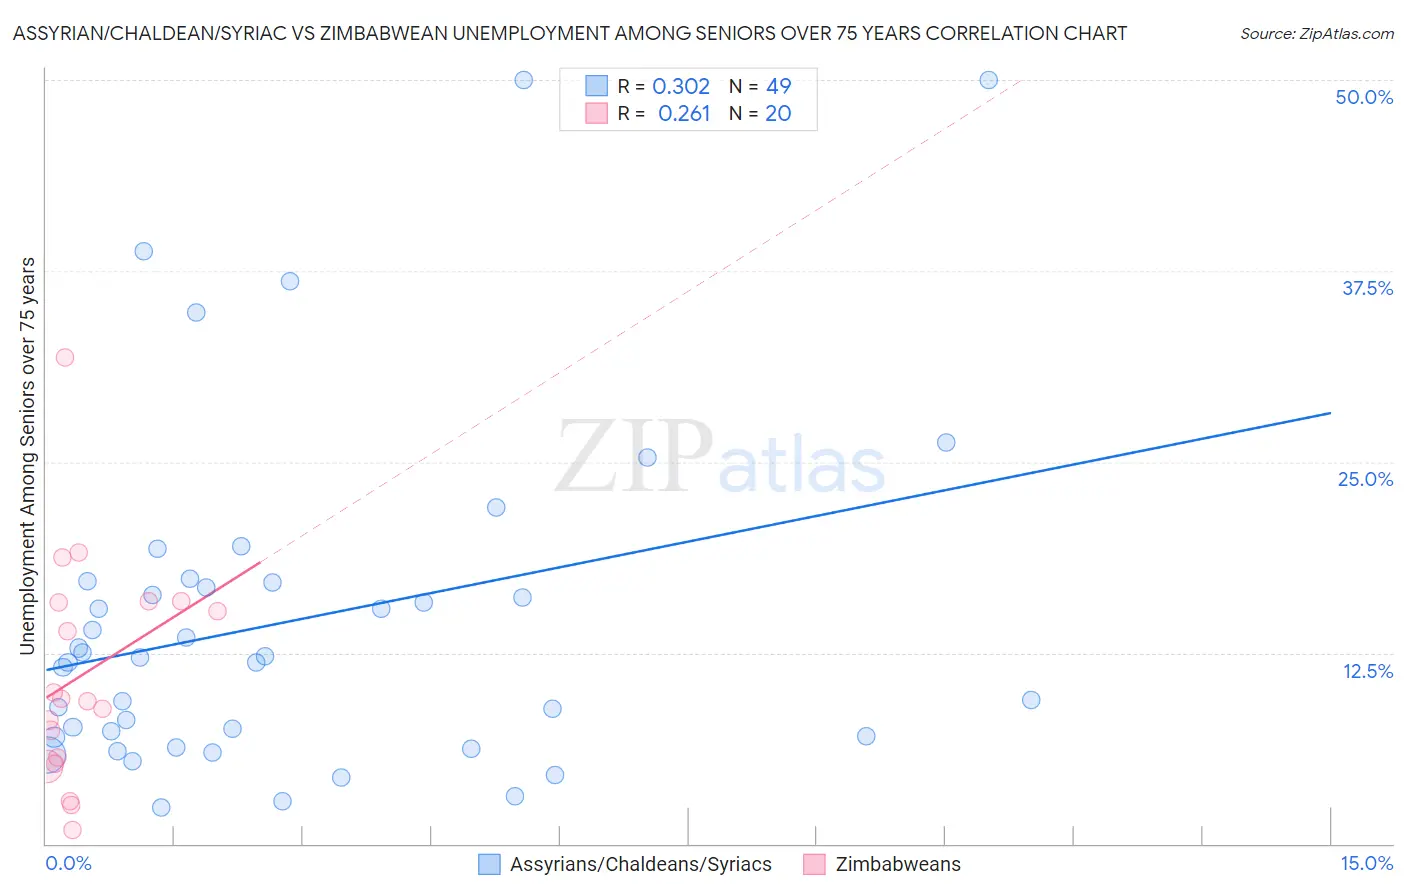
Assyrian/Chaldean/Syriac vs Zimbabwean Unemployment Among Seniors over 75 years Correlation Chart
The statistical analysis conducted on geographies consisting of 82,071,113 people shows a mild positive correlation between the proportion of Assyrians/Chaldeans/Syriacs and unemployment rate among seniors over the age of 75 in the United States with a correlation coefficient (R) of 0.302 and weighted average of 11.1%. Similarly, the statistical analysis conducted on geographies consisting of 56,538,105 people shows a weak positive correlation between the proportion of Zimbabweans and unemployment rate among seniors over the age of 75 in the United States with a correlation coefficient (R) of 0.261 and weighted average of 8.7%, a difference of 26.7%.
Unemployment Among Seniors over 75 years Correlation Summary
| Measurement | Assyrian/Chaldean/Syriac | Zimbabwean |
| Minimum | 2.4% | 0.90% |
| Maximum | 50.0% | 31.8% |
| Range | 47.6% | 30.9% |
| Mean | 14.6% | 11.1% |
| Median | 12.2% | 9.4% |
| Interquartile 25% (IQ1) | 7.0% | 5.4% |
| Interquartile 75% (IQ3) | 17.2% | 15.8% |
| Interquartile Range (IQR) | 10.2% | 10.4% |
| Standard Deviation (Sample) | 11.1% | 7.4% |
| Standard Deviation (Population) | 11.0% | 7.2% |
Similar Demographics by Unemployment Among Seniors over 75 years
Demographics Similar to Assyrians/Chaldeans/Syriacs by Unemployment Among Seniors over 75 years
In terms of unemployment among seniors over 75 years, the demographic groups most similar to Assyrians/Chaldeans/Syriacs are Alaskan Athabascan (11.0%, a difference of 0.35%), French Canadian (11.2%, a difference of 1.1%), Immigrants from Liberia (10.9%, a difference of 1.5%), Tohono O'odham (10.8%, a difference of 2.2%), and Immigrants from North Macedonia (11.3%, a difference of 2.3%).
| Demographics | Rating | Rank | Unemployment Among Seniors over 75 years |
| Dutch | 0.0 /100 | #327 | Tragic 10.4% |
| Immigrants | Portugal | 0.0 /100 | #328 | Tragic 10.5% |
| Tsimshian | 0.0 /100 | #329 | Tragic 10.5% |
| Immigrants | Azores | 0.0 /100 | #330 | Tragic 10.7% |
| Tohono O'odham | 0.0 /100 | #331 | Tragic 10.8% |
| Immigrants | Liberia | 0.0 /100 | #332 | Tragic 10.9% |
| Alaskan Athabascans | 0.0 /100 | #333 | Tragic 11.0% |
| Assyrians/Chaldeans/Syriacs | 0.0 /100 | #334 | Tragic 11.1% |
| French Canadians | 0.0 /100 | #335 | Tragic 11.2% |
| Immigrants | North Macedonia | 0.0 /100 | #336 | Tragic 11.3% |
| Cape Verdeans | 0.0 /100 | #337 | Tragic 11.4% |
| Immigrants | Cabo Verde | 0.0 /100 | #338 | Tragic 12.3% |
| Cajuns | 0.0 /100 | #339 | Tragic 12.5% |
| Yup'ik | 0.0 /100 | #340 | Tragic 12.8% |
| Lumbee | 0.0 /100 | #341 | Tragic 13.5% |
Demographics Similar to Zimbabweans by Unemployment Among Seniors over 75 years
In terms of unemployment among seniors over 75 years, the demographic groups most similar to Zimbabweans are Dominican (8.7%, a difference of 0.12%), Immigrants (8.7%, a difference of 0.12%), Fijian (8.7%, a difference of 0.13%), Immigrants from Lithuania (8.7%, a difference of 0.17%), and Immigrants from Belize (8.7%, a difference of 0.19%).
| Demographics | Rating | Rank | Unemployment Among Seniors over 75 years |
| Immigrants | Guatemala | 68.4 /100 | #163 | Good 8.7% |
| Paraguayans | 62.2 /100 | #164 | Good 8.7% |
| Immigrants | Dominican Republic | 61.4 /100 | #165 | Good 8.7% |
| Immigrants | Belize | 57.6 /100 | #166 | Average 8.7% |
| Immigrants | Eastern Africa | 57.6 /100 | #167 | Average 8.7% |
| Immigrants | Lithuania | 57.2 /100 | #168 | Average 8.7% |
| Fijians | 56.4 /100 | #169 | Average 8.7% |
| Zimbabweans | 54.1 /100 | #170 | Average 8.7% |
| Dominicans | 51.9 /100 | #171 | Average 8.7% |
| Immigrants | Immigrants | 51.8 /100 | #172 | Average 8.7% |
| Australians | 50.3 /100 | #173 | Average 8.7% |
| Immigrants | El Salvador | 49.7 /100 | #174 | Average 8.7% |
| Syrians | 49.6 /100 | #175 | Average 8.7% |
| Somalis | 45.3 /100 | #176 | Average 8.8% |
| Central Americans | 43.3 /100 | #177 | Average 8.8% |