Canadian vs Liberian Unemployment Among Seniors over 75 years
COMPARE
Canadian
Liberian
Unemployment Among Seniors over 75 years
Unemployment Among Seniors over 75 years Comparison
Canadians
Liberians
9.7%
UNEMPLOYMENT AMONG SENIORS OVER 75 YEARS
0.0/ 100
METRIC RATING
288th/ 347
METRIC RANK
10.2%
UNEMPLOYMENT AMONG SENIORS OVER 75 YEARS
0.0/ 100
METRIC RATING
318th/ 347
METRIC RANK
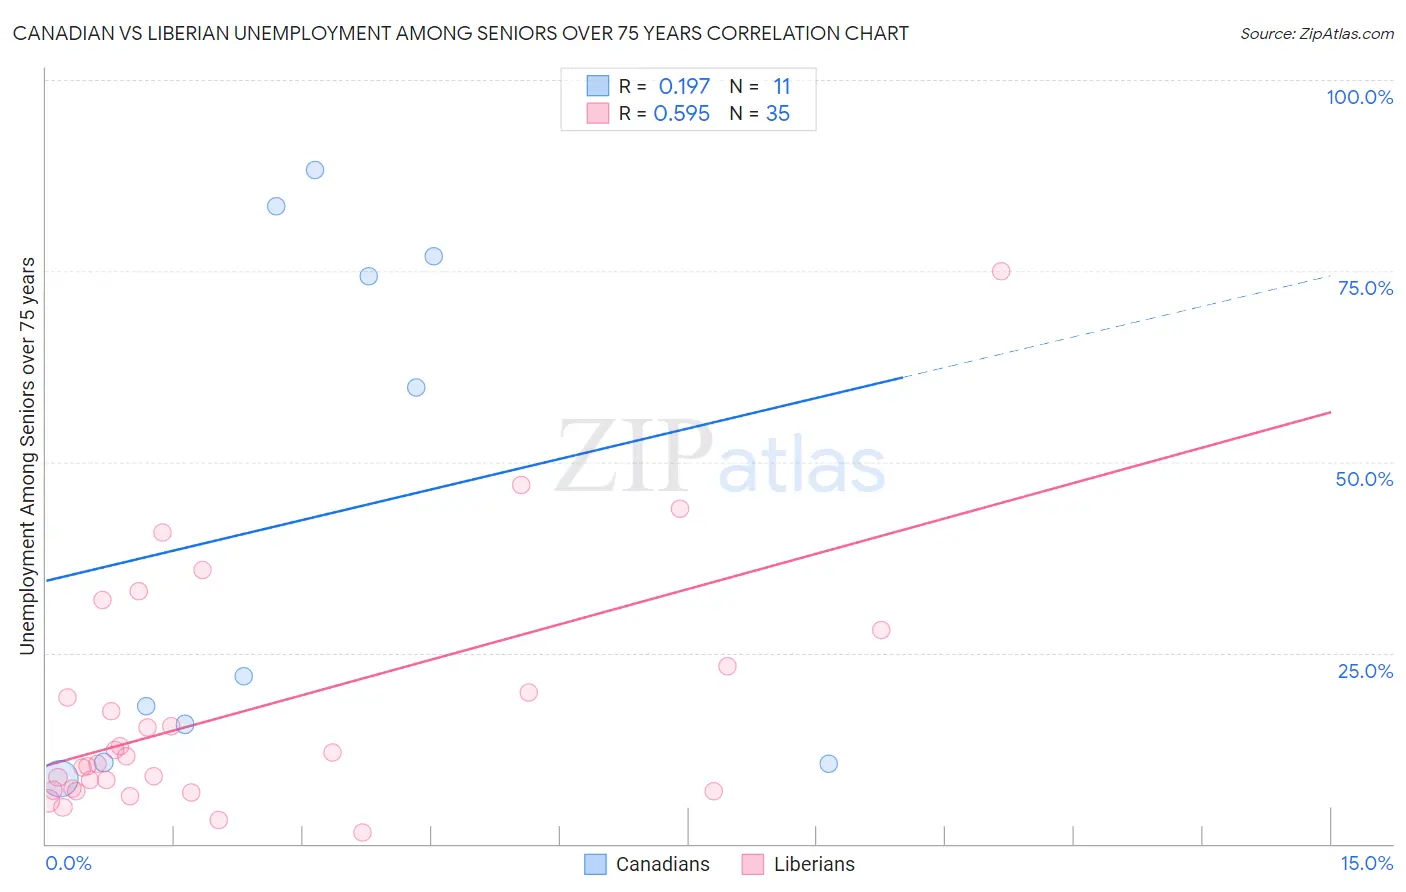
Canadian vs Liberian Unemployment Among Seniors over 75 years Correlation Chart
The statistical analysis conducted on geographies consisting of 211,837,975 people shows a poor positive correlation between the proportion of Canadians and unemployment rate among seniors over the age of 75 in the United States with a correlation coefficient (R) of 0.197 and weighted average of 9.7%. Similarly, the statistical analysis conducted on geographies consisting of 84,949,227 people shows a substantial positive correlation between the proportion of Liberians and unemployment rate among seniors over the age of 75 in the United States with a correlation coefficient (R) of 0.595 and weighted average of 10.2%, a difference of 5.7%.
Unemployment Among Seniors over 75 years Correlation Summary
| Measurement | Canadian | Liberian |
| Minimum | 8.5% | 1.4% |
| Maximum | 88.2% | 75.0% |
| Range | 79.7% | 73.6% |
| Mean | 42.5% | 17.6% |
| Median | 22.0% | 11.5% |
| Interquartile 25% (IQ1) | 10.6% | 7.0% |
| Interquartile 75% (IQ3) | 76.9% | 23.2% |
| Interquartile Range (IQR) | 66.3% | 16.2% |
| Standard Deviation (Sample) | 33.5% | 15.7% |
| Standard Deviation (Population) | 31.9% | 15.5% |
Similar Demographics by Unemployment Among Seniors over 75 years
Demographics Similar to Canadians by Unemployment Among Seniors over 75 years
In terms of unemployment among seniors over 75 years, the demographic groups most similar to Canadians are Czech (9.7%, a difference of 0.080%), Danish (9.7%, a difference of 0.14%), Sioux (9.7%, a difference of 0.15%), Nigerian (9.7%, a difference of 0.25%), and Carpatho Rusyn (9.7%, a difference of 0.32%).
| Demographics | Rating | Rank | Unemployment Among Seniors over 75 years |
| Bangladeshis | 0.1 /100 | #281 | Tragic 9.6% |
| Macedonians | 0.0 /100 | #282 | Tragic 9.6% |
| Immigrants | Nigeria | 0.0 /100 | #283 | Tragic 9.6% |
| Europeans | 0.0 /100 | #284 | Tragic 9.7% |
| Carpatho Rusyns | 0.0 /100 | #285 | Tragic 9.7% |
| Nigerians | 0.0 /100 | #286 | Tragic 9.7% |
| Danes | 0.0 /100 | #287 | Tragic 9.7% |
| Canadians | 0.0 /100 | #288 | Tragic 9.7% |
| Czechs | 0.0 /100 | #289 | Tragic 9.7% |
| Sioux | 0.0 /100 | #290 | Tragic 9.7% |
| Scandinavians | 0.0 /100 | #291 | Tragic 9.7% |
| Immigrants | Western Africa | 0.0 /100 | #292 | Tragic 9.8% |
| Norwegians | 0.0 /100 | #293 | Tragic 9.8% |
| Immigrants | Dominica | 0.0 /100 | #294 | Tragic 9.8% |
| Immigrants | Nonimmigrants | 0.0 /100 | #295 | Tragic 9.8% |
Demographics Similar to Liberians by Unemployment Among Seniors over 75 years
In terms of unemployment among seniors over 75 years, the demographic groups most similar to Liberians are German (10.3%, a difference of 0.070%), Irish (10.2%, a difference of 0.12%), French (10.3%, a difference of 0.29%), Aleut (10.3%, a difference of 0.31%), and Native/Alaskan (10.2%, a difference of 0.49%).
| Demographics | Rating | Rank | Unemployment Among Seniors over 75 years |
| Scottish | 0.0 /100 | #311 | Tragic 10.1% |
| Chippewa | 0.0 /100 | #312 | Tragic 10.1% |
| Nepalese | 0.0 /100 | #313 | Tragic 10.1% |
| Dutch West Indians | 0.0 /100 | #314 | Tragic 10.2% |
| Pennsylvania Germans | 0.0 /100 | #315 | Tragic 10.2% |
| Natives/Alaskans | 0.0 /100 | #316 | Tragic 10.2% |
| Irish | 0.0 /100 | #317 | Tragic 10.2% |
| Liberians | 0.0 /100 | #318 | Tragic 10.2% |
| Germans | 0.0 /100 | #319 | Tragic 10.3% |
| French | 0.0 /100 | #320 | Tragic 10.3% |
| Aleuts | 0.0 /100 | #321 | Tragic 10.3% |
| Poles | 0.0 /100 | #322 | Tragic 10.3% |
| Tongans | 0.0 /100 | #323 | Tragic 10.4% |
| Americans | 0.0 /100 | #324 | Tragic 10.4% |
| Portuguese | 0.0 /100 | #325 | Tragic 10.4% |