Apache vs Blackfeet Unemployment Among Seniors over 65 years
COMPARE
Apache
Blackfeet
Unemployment Among Seniors over 65 years
Unemployment Among Seniors over 65 years Comparison
Apache
Blackfeet
5.3%
UNEMPLOYMENT AMONG SENIORS OVER 65 YEARS
1.3/ 100
METRIC RATING
241st/ 347
METRIC RANK
5.3%
UNEMPLOYMENT AMONG SENIORS OVER 65 YEARS
3.1/ 100
METRIC RATING
234th/ 347
METRIC RANK
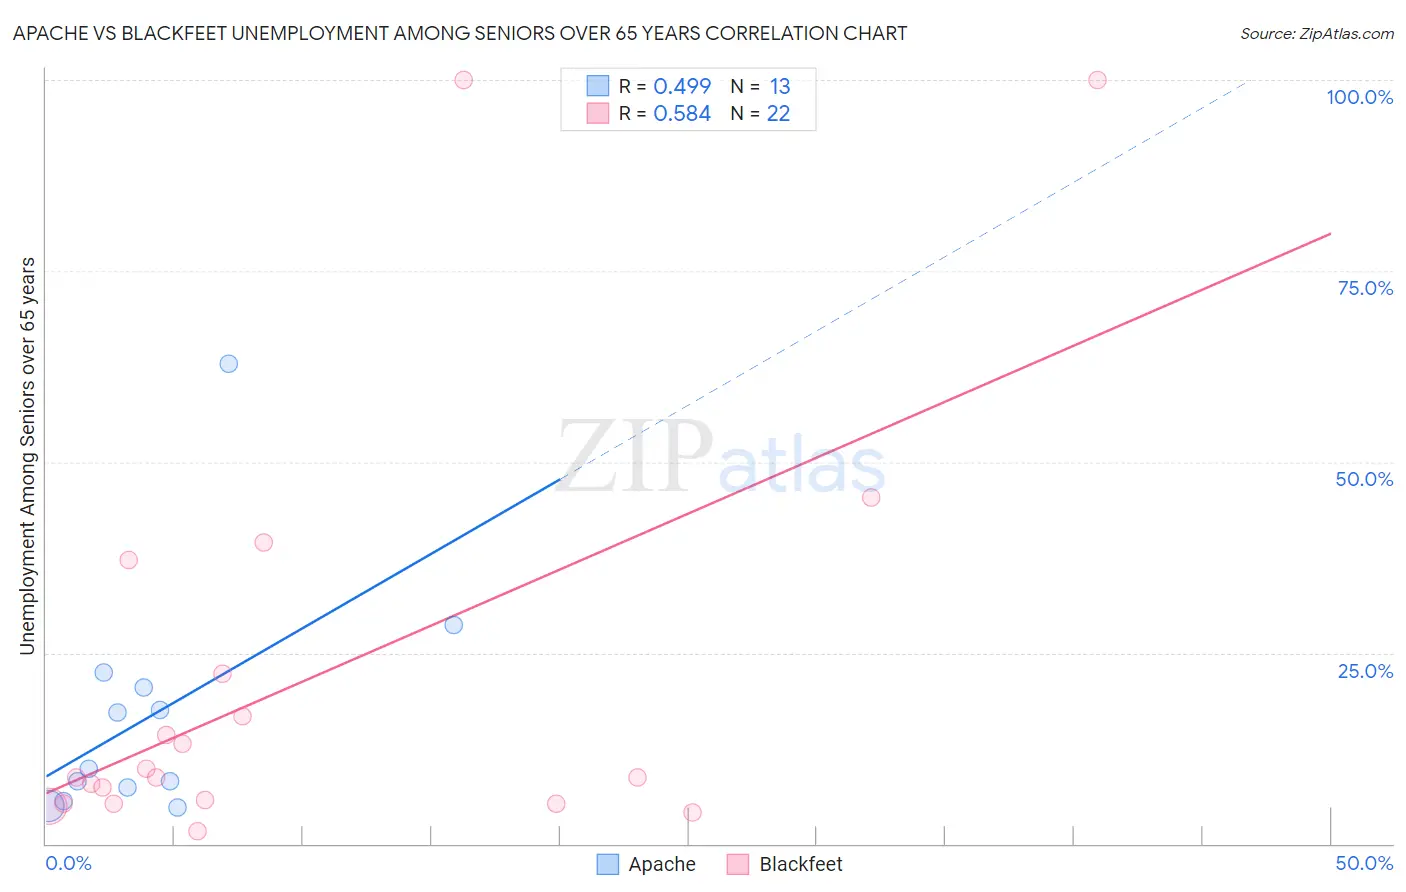
Apache vs Blackfeet Unemployment Among Seniors over 65 years Correlation Chart
The statistical analysis conducted on geographies consisting of 213,447,940 people shows a moderate positive correlation between the proportion of Apache and unemployment rate amomg seniors over the age of 65 in the United States with a correlation coefficient (R) of 0.499 and weighted average of 5.3%. Similarly, the statistical analysis conducted on geographies consisting of 279,008,819 people shows a substantial positive correlation between the proportion of Blackfeet and unemployment rate amomg seniors over the age of 65 in the United States with a correlation coefficient (R) of 0.584 and weighted average of 5.3%, a difference of 0.71%.
Unemployment Among Seniors over 65 years Correlation Summary
| Measurement | Apache | Blackfeet |
| Minimum | 4.7% | 1.6% |
| Maximum | 62.8% | 100.0% |
| Range | 58.1% | 98.4% |
| Mean | 16.7% | 21.4% |
| Median | 9.9% | 8.7% |
| Interquartile 25% (IQ1) | 6.5% | 5.2% |
| Interquartile 75% (IQ3) | 21.5% | 22.3% |
| Interquartile Range (IQR) | 15.0% | 17.1% |
| Standard Deviation (Sample) | 15.8% | 28.2% |
| Standard Deviation (Population) | 15.2% | 27.5% |
Demographics Similar to Apache and Blackfeet by Unemployment Among Seniors over 65 years
In terms of unemployment among seniors over 65 years, the demographic groups most similar to Apache are Immigrants from Trinidad and Tobago (5.3%, a difference of 0.17%), Bahamian (5.3%, a difference of 0.26%), Immigrants from Senegal (5.3%, a difference of 0.28%), Nigerian (5.3%, a difference of 0.29%), and Immigrants from Israel (5.3%, a difference of 0.34%). Similarly, the demographic groups most similar to Blackfeet are Marshallese (5.3%, a difference of 0.0%), Hopi (5.3%, a difference of 0.090%), Immigrants from Albania (5.3%, a difference of 0.10%), Hungarian (5.3%, a difference of 0.18%), and Immigrants from Argentina (5.3%, a difference of 0.20%).
| Demographics | Rating | Rank | Unemployment Among Seniors over 65 years |
| French American Indians | 5.2 /100 | #227 | Tragic 5.3% |
| Haitians | 4.4 /100 | #228 | Tragic 5.3% |
| Samoans | 4.2 /100 | #229 | Tragic 5.3% |
| Immigrants | Argentina | 4.0 /100 | #230 | Tragic 5.3% |
| Hungarians | 3.9 /100 | #231 | Tragic 5.3% |
| Hopi | 3.5 /100 | #232 | Tragic 5.3% |
| Marshallese | 3.1 /100 | #233 | Tragic 5.3% |
| Blackfeet | 3.1 /100 | #234 | Tragic 5.3% |
| Immigrants | Albania | 2.7 /100 | #235 | Tragic 5.3% |
| Immigrants | Costa Rica | 2.1 /100 | #236 | Tragic 5.3% |
| Immigrants | Greece | 2.0 /100 | #237 | Tragic 5.3% |
| Immigrants | Israel | 2.0 /100 | #238 | Tragic 5.3% |
| Immigrants | Senegal | 1.8 /100 | #239 | Tragic 5.3% |
| Immigrants | Trinidad and Tobago | 1.6 /100 | #240 | Tragic 5.3% |
| Apache | 1.3 /100 | #241 | Tragic 5.3% |
| Bahamians | 0.9 /100 | #242 | Tragic 5.3% |
| Nigerians | 0.9 /100 | #243 | Tragic 5.3% |
| Peruvians | 0.8 /100 | #244 | Tragic 5.3% |
| Ottawa | 0.8 /100 | #245 | Tragic 5.3% |
| Colombians | 0.7 /100 | #246 | Tragic 5.3% |
| Immigrants | Caribbean | 0.7 /100 | #247 | Tragic 5.3% |