Guamanian/Chamorro vs Serbian Unemployment Among Seniors over 65 years
COMPARE
Guamanian/Chamorro
Serbian
Unemployment Among Seniors over 65 years
Unemployment Among Seniors over 65 years Comparison
Guamanians/Chamorros
Serbians
5.2%
UNEMPLOYMENT AMONG SENIORS OVER 65 YEARS
22.5/ 100
METRIC RATING
197th/ 347
METRIC RANK
5.0%
UNEMPLOYMENT AMONG SENIORS OVER 65 YEARS
98.4/ 100
METRIC RATING
82nd/ 347
METRIC RANK
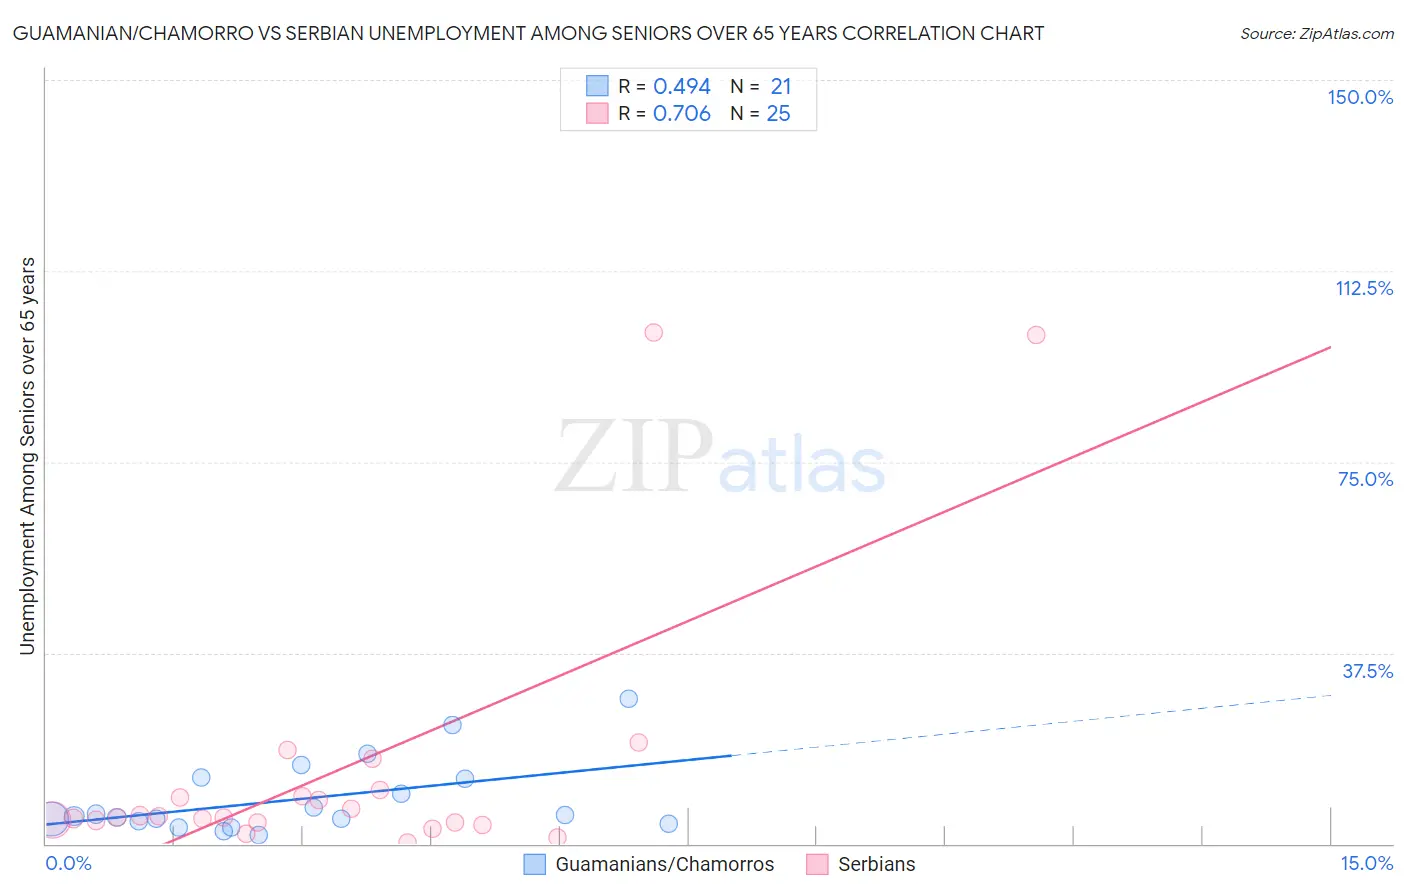
Guamanian/Chamorro vs Serbian Unemployment Among Seniors over 65 years Correlation Chart
The statistical analysis conducted on geographies consisting of 208,240,219 people shows a moderate positive correlation between the proportion of Guamanians/Chamorros and unemployment rate amomg seniors over the age of 65 in the United States with a correlation coefficient (R) of 0.494 and weighted average of 5.2%. Similarly, the statistical analysis conducted on geographies consisting of 247,718,155 people shows a strong positive correlation between the proportion of Serbians and unemployment rate amomg seniors over the age of 65 in the United States with a correlation coefficient (R) of 0.706 and weighted average of 5.0%, a difference of 4.4%.
Unemployment Among Seniors over 65 years Correlation Summary
| Measurement | Guamanian/Chamorro | Serbian |
| Minimum | 1.7% | 0.30% |
| Maximum | 28.5% | 100.4% |
| Range | 26.8% | 100.1% |
| Mean | 8.7% | 14.4% |
| Median | 5.5% | 5.2% |
| Interquartile 25% (IQ1) | 4.2% | 4.2% |
| Interquartile 75% (IQ3) | 12.9% | 10.0% |
| Interquartile Range (IQR) | 8.8% | 5.8% |
| Standard Deviation (Sample) | 7.2% | 26.3% |
| Standard Deviation (Population) | 7.0% | 25.8% |
Similar Demographics by Unemployment Among Seniors over 65 years
Demographics Similar to Guamanians/Chamorros by Unemployment Among Seniors over 65 years
In terms of unemployment among seniors over 65 years, the demographic groups most similar to Guamanians/Chamorros are Immigrants from Poland (5.2%, a difference of 0.080%), Maltese (5.2%, a difference of 0.14%), Immigrants from Europe (5.2%, a difference of 0.17%), Costa Rican (5.2%, a difference of 0.19%), and Immigrants from Pakistan (5.2%, a difference of 0.20%).
| Demographics | Rating | Rank | Unemployment Among Seniors over 65 years |
| Koreans | 31.6 /100 | #190 | Fair 5.2% |
| Immigrants | Denmark | 31.0 /100 | #191 | Fair 5.2% |
| Sioux | 30.8 /100 | #192 | Fair 5.2% |
| Immigrants | Africa | 29.6 /100 | #193 | Fair 5.2% |
| Argentineans | 29.1 /100 | #194 | Fair 5.2% |
| Costa Ricans | 27.0 /100 | #195 | Fair 5.2% |
| Immigrants | Poland | 24.3 /100 | #196 | Fair 5.2% |
| Guamanians/Chamorros | 22.5 /100 | #197 | Fair 5.2% |
| Maltese | 19.6 /100 | #198 | Poor 5.2% |
| Immigrants | Europe | 19.0 /100 | #199 | Poor 5.2% |
| Immigrants | Pakistan | 18.4 /100 | #200 | Poor 5.2% |
| Laotians | 18.1 /100 | #201 | Poor 5.2% |
| Immigrants | Northern Africa | 17.7 /100 | #202 | Poor 5.2% |
| Sub-Saharan Africans | 17.1 /100 | #203 | Poor 5.2% |
| Immigrants | China | 16.9 /100 | #204 | Poor 5.2% |
Demographics Similar to Serbians by Unemployment Among Seniors over 65 years
In terms of unemployment among seniors over 65 years, the demographic groups most similar to Serbians are Estonian (5.0%, a difference of 0.030%), Immigrants from Zimbabwe (5.0%, a difference of 0.030%), Filipino (5.0%, a difference of 0.040%), Immigrants from Hungary (5.0%, a difference of 0.10%), and Immigrants from Taiwan (5.0%, a difference of 0.11%).
| Demographics | Rating | Rank | Unemployment Among Seniors over 65 years |
| British | 99.1 /100 | #75 | Exceptional 4.9% |
| Welsh | 99.1 /100 | #76 | Exceptional 5.0% |
| Thais | 99.1 /100 | #77 | Exceptional 5.0% |
| Slavs | 98.9 /100 | #78 | Exceptional 5.0% |
| Immigrants | Netherlands | 98.8 /100 | #79 | Exceptional 5.0% |
| Immigrants | Ethiopia | 98.6 /100 | #80 | Exceptional 5.0% |
| Estonians | 98.5 /100 | #81 | Exceptional 5.0% |
| Serbians | 98.4 /100 | #82 | Exceptional 5.0% |
| Immigrants | Zimbabwe | 98.3 /100 | #83 | Exceptional 5.0% |
| Filipinos | 98.3 /100 | #84 | Exceptional 5.0% |
| Immigrants | Hungary | 98.2 /100 | #85 | Exceptional 5.0% |
| Immigrants | Taiwan | 98.2 /100 | #86 | Exceptional 5.0% |
| Immigrants | Switzerland | 98.2 /100 | #87 | Exceptional 5.0% |
| Afghans | 97.6 /100 | #88 | Exceptional 5.0% |
| Immigrants | South Central Asia | 97.6 /100 | #89 | Exceptional 5.0% |