Guamanian/Chamorro vs Subsaharan African Unemployment Among Women with Children Under 18 years
COMPARE
Guamanian/Chamorro
Subsaharan African
Unemployment Among Women with Children Under 18 years
Unemployment Among Women with Children Under 18 years Comparison
Guamanians/Chamorros
Sub-Saharan Africans
5.8%
UNEMPLOYMENT AMONG WOMEN WITH CHILDREN UNDER 18 YEARS
2.9/ 100
METRIC RATING
234th/ 347
METRIC RANK
6.2%
UNEMPLOYMENT AMONG WOMEN WITH CHILDREN UNDER 18 YEARS
0.1/ 100
METRIC RATING
266th/ 347
METRIC RANK
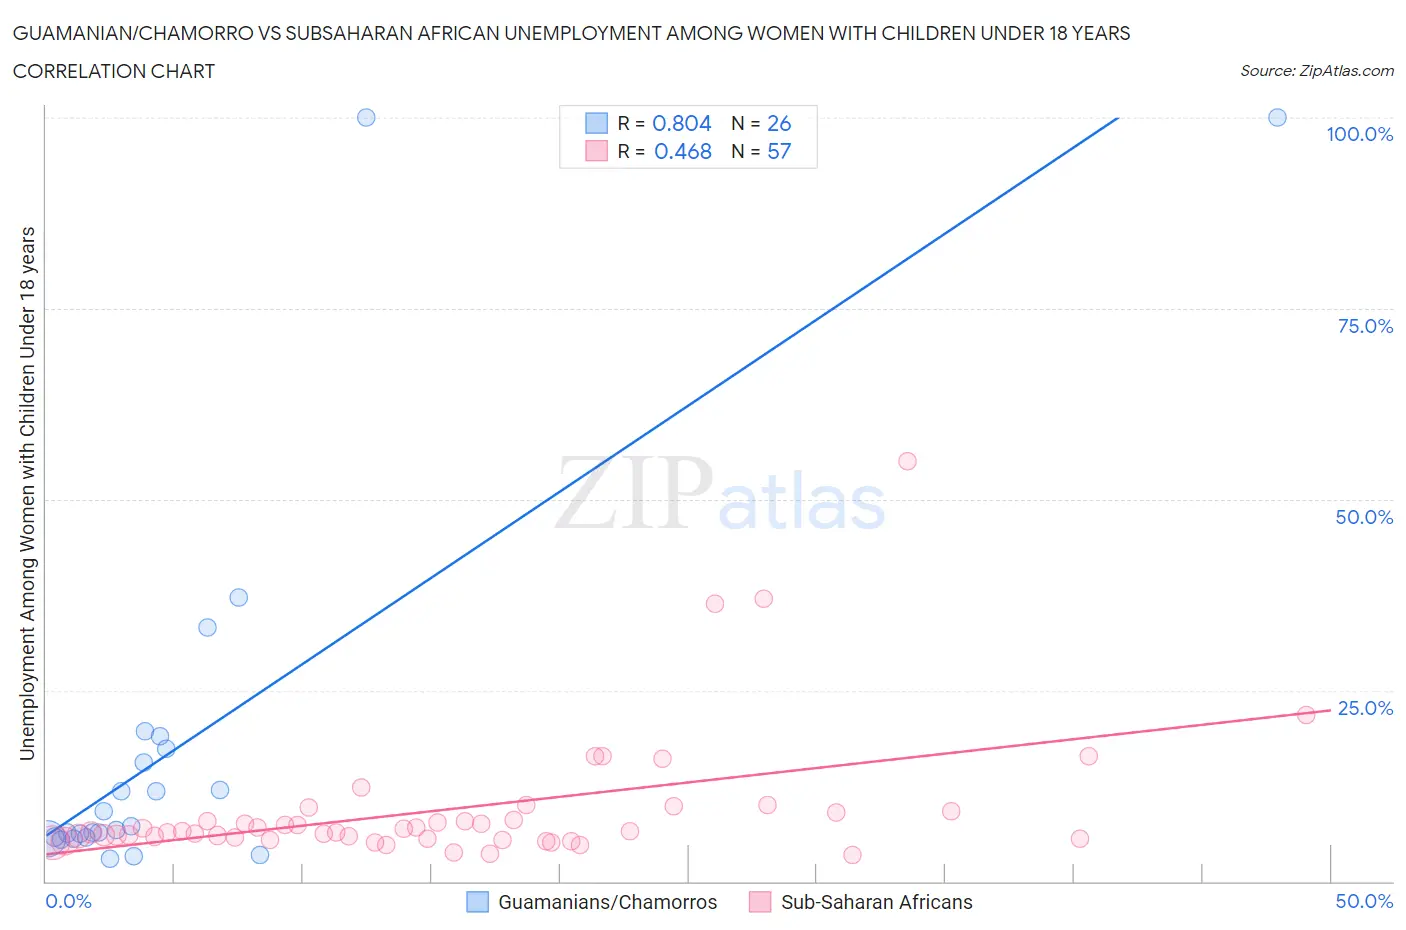
Guamanian/Chamorro vs Subsaharan African Unemployment Among Women with Children Under 18 years Correlation Chart
The statistical analysis conducted on geographies consisting of 217,637,806 people shows a very strong positive correlation between the proportion of Guamanians/Chamorros and unemployment rate among women with children under the age of 18 in the United States with a correlation coefficient (R) of 0.804 and weighted average of 5.8%. Similarly, the statistical analysis conducted on geographies consisting of 479,418,047 people shows a moderate positive correlation between the proportion of Sub-Saharan Africans and unemployment rate among women with children under the age of 18 in the United States with a correlation coefficient (R) of 0.468 and weighted average of 6.2%, a difference of 6.6%.
Unemployment Among Women with Children Under 18 years Correlation Summary
| Measurement | Guamanian/Chamorro | Subsaharan African |
| Minimum | 3.0% | 3.4% |
| Maximum | 100.0% | 55.0% |
| Range | 97.0% | 51.6% |
| Mean | 17.8% | 9.5% |
| Median | 6.9% | 6.5% |
| Interquartile 25% (IQ1) | 5.8% | 5.5% |
| Interquartile 75% (IQ3) | 17.3% | 9.1% |
| Interquartile Range (IQR) | 11.5% | 3.5% |
| Standard Deviation (Sample) | 25.7% | 8.9% |
| Standard Deviation (Population) | 25.2% | 8.8% |
Similar Demographics by Unemployment Among Women with Children Under 18 years
Demographics Similar to Guamanians/Chamorros by Unemployment Among Women with Children Under 18 years
In terms of unemployment among women with children under 18 years, the demographic groups most similar to Guamanians/Chamorros are Immigrants from Middle Africa (5.8%, a difference of 0.040%), Spanish American (5.8%, a difference of 0.11%), Creek (5.8%, a difference of 0.13%), Immigrants from Africa (5.8%, a difference of 0.15%), and Immigrants from South America (5.8%, a difference of 0.21%).
| Demographics | Rating | Rank | Unemployment Among Women with Children Under 18 years |
| Sierra Leoneans | 3.8 /100 | #227 | Tragic 5.8% |
| Somalis | 3.5 /100 | #228 | Tragic 5.8% |
| Immigrants | Panama | 3.4 /100 | #229 | Tragic 5.8% |
| Immigrants | South America | 3.2 /100 | #230 | Tragic 5.8% |
| Immigrants | Africa | 3.1 /100 | #231 | Tragic 5.8% |
| Creek | 3.1 /100 | #232 | Tragic 5.8% |
| Spanish Americans | 3.1 /100 | #233 | Tragic 5.8% |
| Guamanians/Chamorros | 2.9 /100 | #234 | Tragic 5.8% |
| Immigrants | Middle Africa | 2.8 /100 | #235 | Tragic 5.8% |
| Alsatians | 2.5 /100 | #236 | Tragic 5.8% |
| Immigrants | Lebanon | 2.4 /100 | #237 | Tragic 5.8% |
| Immigrants | Somalia | 2.2 /100 | #238 | Tragic 5.8% |
| Immigrants | Sierra Leone | 2.0 /100 | #239 | Tragic 5.8% |
| Immigrants | Immigrants | 2.0 /100 | #240 | Tragic 5.8% |
| Brazilians | 1.6 /100 | #241 | Tragic 5.8% |
Demographics Similar to Sub-Saharan Africans by Unemployment Among Women with Children Under 18 years
In terms of unemployment among women with children under 18 years, the demographic groups most similar to Sub-Saharan Africans are French American Indian (6.2%, a difference of 0.010%), Trinidadian and Tobagonian (6.2%, a difference of 0.030%), Cajun (6.2%, a difference of 0.070%), Ghanaian (6.2%, a difference of 0.070%), and Immigrants from Bahamas (6.1%, a difference of 0.33%).
| Demographics | Rating | Rank | Unemployment Among Women with Children Under 18 years |
| Ottawa | 0.1 /100 | #259 | Tragic 6.1% |
| Nigerians | 0.1 /100 | #260 | Tragic 6.1% |
| Immigrants | Liberia | 0.1 /100 | #261 | Tragic 6.1% |
| Immigrants | Trinidad and Tobago | 0.1 /100 | #262 | Tragic 6.1% |
| Spanish American Indians | 0.1 /100 | #263 | Tragic 6.1% |
| Comanche | 0.1 /100 | #264 | Tragic 6.1% |
| Immigrants | Bahamas | 0.1 /100 | #265 | Tragic 6.1% |
| Sub-Saharan Africans | 0.1 /100 | #266 | Tragic 6.2% |
| French American Indians | 0.1 /100 | #267 | Tragic 6.2% |
| Trinidadians and Tobagonians | 0.1 /100 | #268 | Tragic 6.2% |
| Cajuns | 0.1 /100 | #269 | Tragic 6.2% |
| Ghanaians | 0.1 /100 | #270 | Tragic 6.2% |
| Central Americans | 0.0 /100 | #271 | Tragic 6.2% |
| Salvadorans | 0.0 /100 | #272 | Tragic 6.2% |
| Immigrants | Western Africa | 0.0 /100 | #273 | Tragic 6.2% |