Guamanian/Chamorro vs Assyrian/Chaldean/Syriac Unemployment Among Women with Children Under 18 years
COMPARE
Guamanian/Chamorro
Assyrian/Chaldean/Syriac
Unemployment Among Women with Children Under 18 years
Unemployment Among Women with Children Under 18 years Comparison
Guamanians/Chamorros
Assyrians/Chaldeans/Syriacs
5.8%
UNEMPLOYMENT AMONG WOMEN WITH CHILDREN UNDER 18 YEARS
2.9/ 100
METRIC RATING
234th/ 347
METRIC RANK
5.1%
UNEMPLOYMENT AMONG WOMEN WITH CHILDREN UNDER 18 YEARS
95.7/ 100
METRIC RATING
78th/ 347
METRIC RANK
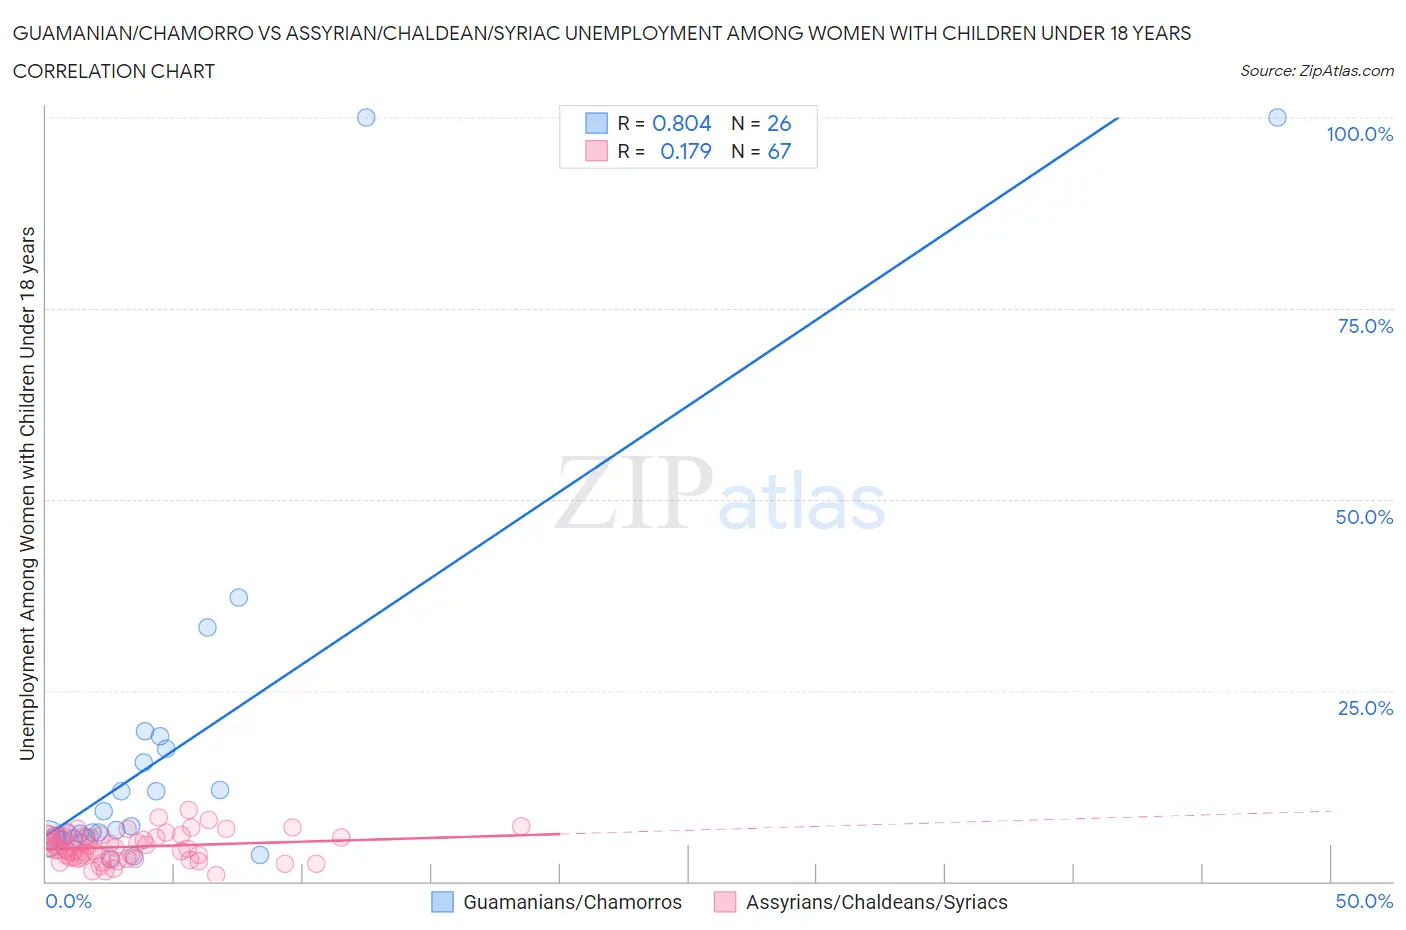
Guamanian/Chamorro vs Assyrian/Chaldean/Syriac Unemployment Among Women with Children Under 18 years Correlation Chart
The statistical analysis conducted on geographies consisting of 217,637,806 people shows a very strong positive correlation between the proportion of Guamanians/Chamorros and unemployment rate among women with children under the age of 18 in the United States with a correlation coefficient (R) of 0.804 and weighted average of 5.8%. Similarly, the statistical analysis conducted on geographies consisting of 108,875,317 people shows a poor positive correlation between the proportion of Assyrians/Chaldeans/Syriacs and unemployment rate among women with children under the age of 18 in the United States with a correlation coefficient (R) of 0.179 and weighted average of 5.1%, a difference of 12.4%.
Unemployment Among Women with Children Under 18 years Correlation Summary
| Measurement | Guamanian/Chamorro | Assyrian/Chaldean/Syriac |
| Minimum | 3.0% | 0.80% |
| Maximum | 100.0% | 9.3% |
| Range | 97.0% | 8.5% |
| Mean | 17.8% | 4.5% |
| Median | 6.9% | 4.2% |
| Interquartile 25% (IQ1) | 5.8% | 3.0% |
| Interquartile 75% (IQ3) | 17.3% | 5.8% |
| Interquartile Range (IQR) | 11.5% | 2.8% |
| Standard Deviation (Sample) | 25.7% | 1.8% |
| Standard Deviation (Population) | 25.2% | 1.8% |
Similar Demographics by Unemployment Among Women with Children Under 18 years
Demographics Similar to Guamanians/Chamorros by Unemployment Among Women with Children Under 18 years
In terms of unemployment among women with children under 18 years, the demographic groups most similar to Guamanians/Chamorros are Immigrants from Middle Africa (5.8%, a difference of 0.040%), Spanish American (5.8%, a difference of 0.11%), Creek (5.8%, a difference of 0.13%), Immigrants from Africa (5.8%, a difference of 0.15%), and Immigrants from South America (5.8%, a difference of 0.21%).
| Demographics | Rating | Rank | Unemployment Among Women with Children Under 18 years |
| Sierra Leoneans | 3.8 /100 | #227 | Tragic 5.8% |
| Somalis | 3.5 /100 | #228 | Tragic 5.8% |
| Immigrants | Panama | 3.4 /100 | #229 | Tragic 5.8% |
| Immigrants | South America | 3.2 /100 | #230 | Tragic 5.8% |
| Immigrants | Africa | 3.1 /100 | #231 | Tragic 5.8% |
| Creek | 3.1 /100 | #232 | Tragic 5.8% |
| Spanish Americans | 3.1 /100 | #233 | Tragic 5.8% |
| Guamanians/Chamorros | 2.9 /100 | #234 | Tragic 5.8% |
| Immigrants | Middle Africa | 2.8 /100 | #235 | Tragic 5.8% |
| Alsatians | 2.5 /100 | #236 | Tragic 5.8% |
| Immigrants | Lebanon | 2.4 /100 | #237 | Tragic 5.8% |
| Immigrants | Somalia | 2.2 /100 | #238 | Tragic 5.8% |
| Immigrants | Sierra Leone | 2.0 /100 | #239 | Tragic 5.8% |
| Immigrants | Immigrants | 2.0 /100 | #240 | Tragic 5.8% |
| Brazilians | 1.6 /100 | #241 | Tragic 5.8% |
Demographics Similar to Assyrians/Chaldeans/Syriacs by Unemployment Among Women with Children Under 18 years
In terms of unemployment among women with children under 18 years, the demographic groups most similar to Assyrians/Chaldeans/Syriacs are Zimbabwean (5.1%, a difference of 0.020%), Immigrants from Croatia (5.1%, a difference of 0.020%), Puget Sound Salish (5.1%, a difference of 0.040%), Immigrants from Asia (5.1%, a difference of 0.070%), and Bolivian (5.1%, a difference of 0.070%).
| Demographics | Rating | Rank | Unemployment Among Women with Children Under 18 years |
| Serbians | 96.5 /100 | #71 | Exceptional 5.1% |
| Immigrants | Bolivia | 96.1 /100 | #72 | Exceptional 5.1% |
| Albanians | 95.9 /100 | #73 | Exceptional 5.1% |
| Immigrants | Northern Europe | 95.9 /100 | #74 | Exceptional 5.1% |
| Immigrants | Asia | 95.8 /100 | #75 | Exceptional 5.1% |
| Puget Sound Salish | 95.8 /100 | #76 | Exceptional 5.1% |
| Zimbabweans | 95.7 /100 | #77 | Exceptional 5.1% |
| Assyrians/Chaldeans/Syriacs | 95.7 /100 | #78 | Exceptional 5.1% |
| Immigrants | Croatia | 95.6 /100 | #79 | Exceptional 5.1% |
| Bolivians | 95.5 /100 | #80 | Exceptional 5.1% |
| Immigrants | Lithuania | 95.4 /100 | #81 | Exceptional 5.2% |
| Romanians | 95.3 /100 | #82 | Exceptional 5.2% |
| Maltese | 95.1 /100 | #83 | Exceptional 5.2% |
| Australians | 95.1 /100 | #84 | Exceptional 5.2% |
| Paraguayans | 94.8 /100 | #85 | Exceptional 5.2% |