Immigrants from Iraq vs Immigrants from Asia Male Unemployment
COMPARE
Immigrants from Iraq
Immigrants from Asia
Male Unemployment
Male Unemployment Comparison
Immigrants from Iraq
Immigrants from Asia
5.3%
MALE UNEMPLOYMENT
48.1/ 100
METRIC RATING
175th/ 347
METRIC RANK
5.1%
MALE UNEMPLOYMENT
89.6/ 100
METRIC RATING
115th/ 347
METRIC RANK
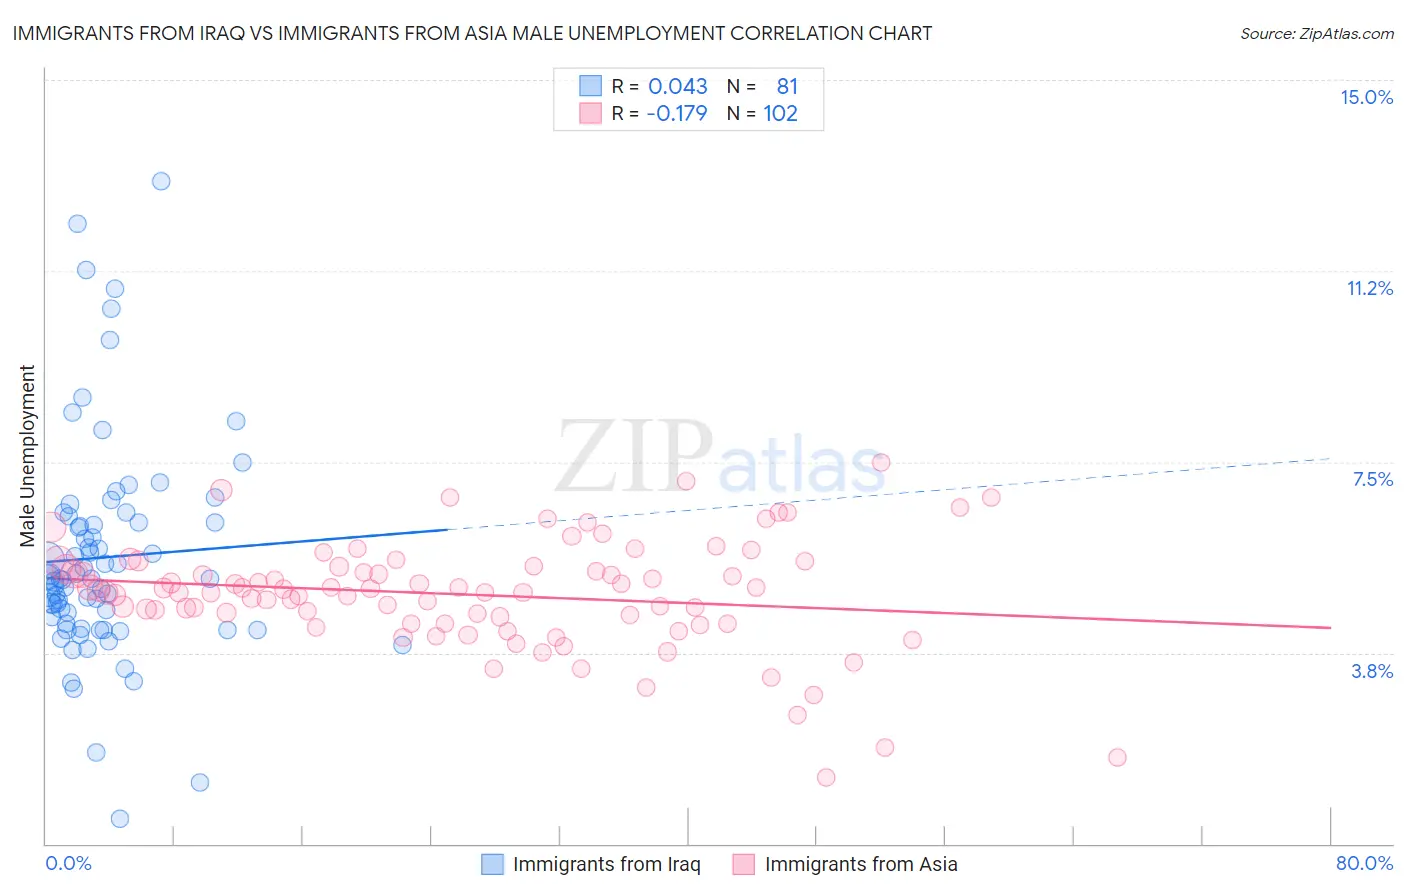
Immigrants from Iraq vs Immigrants from Asia Male Unemployment Correlation Chart
The statistical analysis conducted on geographies consisting of 194,621,150 people shows no correlation between the proportion of Immigrants from Iraq and unemployment rate among males in the United States with a correlation coefficient (R) of 0.043 and weighted average of 5.3%. Similarly, the statistical analysis conducted on geographies consisting of 542,340,626 people shows a poor negative correlation between the proportion of Immigrants from Asia and unemployment rate among males in the United States with a correlation coefficient (R) of -0.179 and weighted average of 5.1%, a difference of 3.4%.
Male Unemployment Correlation Summary
| Measurement | Immigrants from Iraq | Immigrants from Asia |
| Minimum | 0.50% | 1.3% |
| Maximum | 13.0% | 7.5% |
| Range | 12.5% | 6.2% |
| Mean | 5.6% | 4.9% |
| Median | 5.2% | 5.0% |
| Interquartile 25% (IQ1) | 4.3% | 4.3% |
| Interquartile 75% (IQ3) | 6.4% | 5.4% |
| Interquartile Range (IQR) | 2.1% | 1.1% |
| Standard Deviation (Sample) | 2.2% | 1.1% |
| Standard Deviation (Population) | 2.2% | 1.1% |
Similar Demographics by Male Unemployment
Demographics Similar to Immigrants from Iraq by Male Unemployment
In terms of male unemployment, the demographic groups most similar to Immigrants from Iraq are Immigrants from Iran (5.3%, a difference of 0.11%), Immigrants from Poland (5.3%, a difference of 0.12%), Immigrants from Russia (5.3%, a difference of 0.15%), Immigrants from Kazakhstan (5.3%, a difference of 0.16%), and Immigrants from Peru (5.3%, a difference of 0.20%).
| Demographics | Rating | Rank | Male Unemployment |
| Immigrants | Ireland | 57.7 /100 | #168 | Average 5.3% |
| Immigrants | Congo | 57.4 /100 | #169 | Average 5.3% |
| Immigrants | Eastern Europe | 54.1 /100 | #170 | Average 5.3% |
| Peruvians | 51.9 /100 | #171 | Average 5.3% |
| Immigrants | Kazakhstan | 50.8 /100 | #172 | Average 5.3% |
| Immigrants | Russia | 50.7 /100 | #173 | Average 5.3% |
| Immigrants | Iran | 50.0 /100 | #174 | Average 5.3% |
| Immigrants | Iraq | 48.1 /100 | #175 | Average 5.3% |
| Immigrants | Poland | 46.0 /100 | #176 | Average 5.3% |
| Immigrants | Peru | 44.6 /100 | #177 | Average 5.3% |
| Osage | 42.5 /100 | #178 | Average 5.3% |
| Immigrants | Oceania | 40.8 /100 | #179 | Average 5.3% |
| Malaysians | 39.6 /100 | #180 | Fair 5.3% |
| Immigrants | Afghanistan | 37.9 /100 | #181 | Fair 5.3% |
| Potawatomi | 37.8 /100 | #182 | Fair 5.3% |
Demographics Similar to Immigrants from Asia by Male Unemployment
In terms of male unemployment, the demographic groups most similar to Immigrants from Asia are Romanian (5.1%, a difference of 0.030%), Immigrants from Denmark (5.1%, a difference of 0.040%), Estonian (5.1%, a difference of 0.090%), Immigrants from Moldova (5.1%, a difference of 0.11%), and Immigrants from Austria (5.1%, a difference of 0.11%).
| Demographics | Rating | Rank | Male Unemployment |
| Immigrants | Nicaragua | 91.2 /100 | #108 | Exceptional 5.1% |
| Immigrants | Pakistan | 90.9 /100 | #109 | Exceptional 5.1% |
| Immigrants | England | 90.8 /100 | #110 | Exceptional 5.1% |
| Immigrants | Eastern Asia | 90.8 /100 | #111 | Exceptional 5.1% |
| Immigrants | Moldova | 90.3 /100 | #112 | Exceptional 5.1% |
| Immigrants | Austria | 90.3 /100 | #113 | Exceptional 5.1% |
| Romanians | 89.8 /100 | #114 | Excellent 5.1% |
| Immigrants | Asia | 89.6 /100 | #115 | Excellent 5.1% |
| Immigrants | Denmark | 89.4 /100 | #116 | Excellent 5.1% |
| Estonians | 89.0 /100 | #117 | Excellent 5.1% |
| Cypriots | 88.8 /100 | #118 | Excellent 5.1% |
| French Canadians | 88.6 /100 | #119 | Excellent 5.1% |
| Ukrainians | 88.4 /100 | #120 | Excellent 5.1% |
| Mongolians | 88.4 /100 | #121 | Excellent 5.1% |
| Nicaraguans | 88.2 /100 | #122 | Excellent 5.1% |