Senegalese vs Immigrants from Asia Male Unemployment
COMPARE
Senegalese
Immigrants from Asia
Male Unemployment
Male Unemployment Comparison
Senegalese
Immigrants from Asia
6.4%
MALE UNEMPLOYMENT
0.0/ 100
METRIC RATING
294th/ 347
METRIC RANK
5.1%
MALE UNEMPLOYMENT
89.6/ 100
METRIC RATING
115th/ 347
METRIC RANK
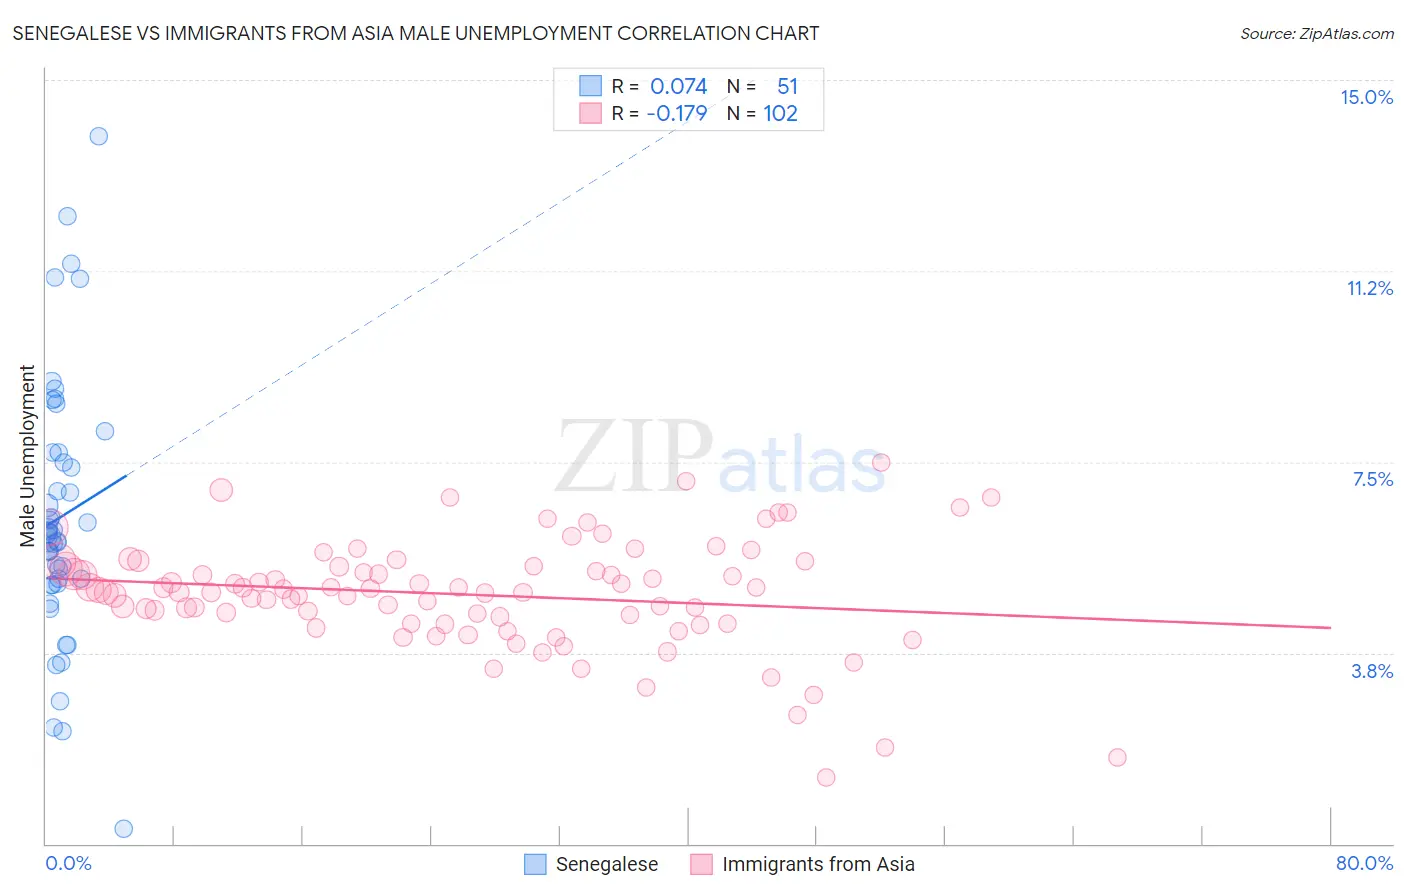
Senegalese vs Immigrants from Asia Male Unemployment Correlation Chart
The statistical analysis conducted on geographies consisting of 78,095,938 people shows a slight positive correlation between the proportion of Senegalese and unemployment rate among males in the United States with a correlation coefficient (R) of 0.074 and weighted average of 6.4%. Similarly, the statistical analysis conducted on geographies consisting of 542,340,626 people shows a poor negative correlation between the proportion of Immigrants from Asia and unemployment rate among males in the United States with a correlation coefficient (R) of -0.179 and weighted average of 5.1%, a difference of 25.7%.
Male Unemployment Correlation Summary
| Measurement | Senegalese | Immigrants from Asia |
| Minimum | 0.30% | 1.3% |
| Maximum | 13.9% | 7.5% |
| Range | 13.6% | 6.2% |
| Mean | 6.4% | 4.9% |
| Median | 6.0% | 5.0% |
| Interquartile 25% (IQ1) | 5.1% | 4.3% |
| Interquartile 75% (IQ3) | 7.7% | 5.4% |
| Interquartile Range (IQR) | 2.6% | 1.1% |
| Standard Deviation (Sample) | 2.6% | 1.1% |
| Standard Deviation (Population) | 2.6% | 1.1% |
Similar Demographics by Male Unemployment
Demographics Similar to Senegalese by Male Unemployment
In terms of male unemployment, the demographic groups most similar to Senegalese are Haitian (6.4%, a difference of 0.11%), Nepalese (6.4%, a difference of 0.14%), Immigrants from the Azores (6.4%, a difference of 0.48%), Belizean (6.5%, a difference of 0.85%), and U.S. Virgin Islander (6.4%, a difference of 1.0%).
| Demographics | Rating | Rank | Male Unemployment |
| Central American Indians | 0.0 /100 | #287 | Tragic 6.3% |
| Immigrants | Senegal | 0.0 /100 | #288 | Tragic 6.3% |
| Immigrants | Caribbean | 0.0 /100 | #289 | Tragic 6.3% |
| U.S. Virgin Islanders | 0.0 /100 | #290 | Tragic 6.4% |
| Immigrants | Azores | 0.0 /100 | #291 | Tragic 6.4% |
| Nepalese | 0.0 /100 | #292 | Tragic 6.4% |
| Haitians | 0.0 /100 | #293 | Tragic 6.4% |
| Senegalese | 0.0 /100 | #294 | Tragic 6.4% |
| Belizeans | 0.0 /100 | #295 | Tragic 6.5% |
| Immigrants | Haiti | 0.0 /100 | #296 | Tragic 6.5% |
| Chippewa | 0.0 /100 | #297 | Tragic 6.6% |
| Jamaicans | 0.0 /100 | #298 | Tragic 6.6% |
| Immigrants | Bangladesh | 0.0 /100 | #299 | Tragic 6.6% |
| Vietnamese | 0.0 /100 | #300 | Tragic 6.6% |
| Immigrants | Belize | 0.0 /100 | #301 | Tragic 6.6% |
Demographics Similar to Immigrants from Asia by Male Unemployment
In terms of male unemployment, the demographic groups most similar to Immigrants from Asia are Romanian (5.1%, a difference of 0.030%), Immigrants from Denmark (5.1%, a difference of 0.040%), Estonian (5.1%, a difference of 0.090%), Immigrants from Moldova (5.1%, a difference of 0.11%), and Immigrants from Austria (5.1%, a difference of 0.11%).
| Demographics | Rating | Rank | Male Unemployment |
| Immigrants | Nicaragua | 91.2 /100 | #108 | Exceptional 5.1% |
| Immigrants | Pakistan | 90.9 /100 | #109 | Exceptional 5.1% |
| Immigrants | England | 90.8 /100 | #110 | Exceptional 5.1% |
| Immigrants | Eastern Asia | 90.8 /100 | #111 | Exceptional 5.1% |
| Immigrants | Moldova | 90.3 /100 | #112 | Exceptional 5.1% |
| Immigrants | Austria | 90.3 /100 | #113 | Exceptional 5.1% |
| Romanians | 89.8 /100 | #114 | Excellent 5.1% |
| Immigrants | Asia | 89.6 /100 | #115 | Excellent 5.1% |
| Immigrants | Denmark | 89.4 /100 | #116 | Excellent 5.1% |
| Estonians | 89.0 /100 | #117 | Excellent 5.1% |
| Cypriots | 88.8 /100 | #118 | Excellent 5.1% |
| French Canadians | 88.6 /100 | #119 | Excellent 5.1% |
| Ukrainians | 88.4 /100 | #120 | Excellent 5.1% |
| Mongolians | 88.4 /100 | #121 | Excellent 5.1% |
| Nicaraguans | 88.2 /100 | #122 | Excellent 5.1% |