German Russian vs Immigrants from Southern Europe Unemployment Among Ages 65 to 74 years
COMPARE
German Russian
Immigrants from Southern Europe
Unemployment Among Ages 65 to 74 years
Unemployment Among Ages 65 to 74 years Comparison
German Russians
Immigrants from Southern Europe
5.5%
UNEMPLOYMENT AMONG AGES 65 TO 74 YEARS
1.6/ 100
METRIC RATING
239th/ 347
METRIC RANK
5.6%
UNEMPLOYMENT AMONG AGES 65 TO 74 YEARS
0.3/ 100
METRIC RATING
257th/ 347
METRIC RANK
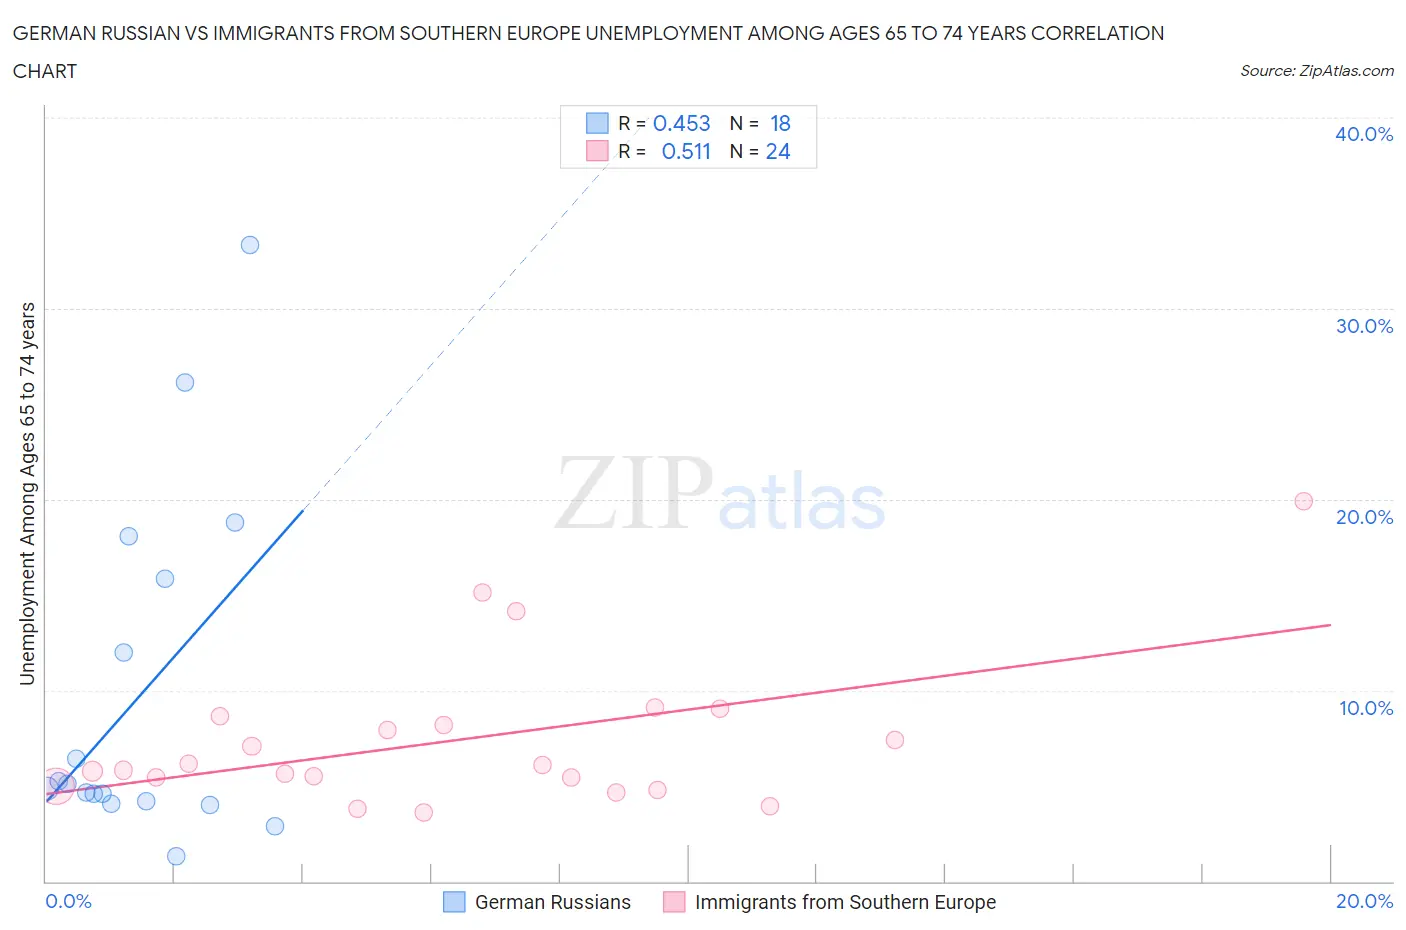
German Russian vs Immigrants from Southern Europe Unemployment Among Ages 65 to 74 years Correlation Chart
The statistical analysis conducted on geographies consisting of 90,944,142 people shows a moderate positive correlation between the proportion of German Russians and unemployment rate among population between the ages 65 and 74 in the United States with a correlation coefficient (R) of 0.453 and weighted average of 5.5%. Similarly, the statistical analysis conducted on geographies consisting of 356,658,922 people shows a substantial positive correlation between the proportion of Immigrants from Southern Europe and unemployment rate among population between the ages 65 and 74 in the United States with a correlation coefficient (R) of 0.511 and weighted average of 5.6%, a difference of 1.3%.
Unemployment Among Ages 65 to 74 years Correlation Summary
| Measurement | German Russian | Immigrants from Southern Europe |
| Minimum | 1.3% | 3.6% |
| Maximum | 33.3% | 19.9% |
| Range | 32.0% | 16.3% |
| Mean | 9.8% | 7.4% |
| Median | 5.0% | 5.9% |
| Interquartile 25% (IQ1) | 4.2% | 5.2% |
| Interquartile 75% (IQ3) | 15.8% | 8.4% |
| Interquartile Range (IQR) | 11.6% | 3.2% |
| Standard Deviation (Sample) | 9.0% | 3.9% |
| Standard Deviation (Population) | 8.8% | 3.8% |
Demographics Similar to German Russians and Immigrants from Southern Europe by Unemployment Among Ages 65 to 74 years
In terms of unemployment among ages 65 to 74 years, the demographic groups most similar to German Russians are Cajun (5.5%, a difference of 0.080%), Ghanaian (5.6%, a difference of 0.10%), Cree (5.6%, a difference of 0.13%), Immigrants from Ghana (5.6%, a difference of 0.13%), and Immigrants from Peru (5.6%, a difference of 0.19%). Similarly, the demographic groups most similar to Immigrants from Southern Europe are Native Hawaiian (5.6%, a difference of 0.12%), Immigrants from Western Africa (5.6%, a difference of 0.16%), Immigrants from Haiti (5.6%, a difference of 0.22%), Immigrants from Costa Rica (5.6%, a difference of 0.30%), and Immigrants from Brazil (5.6%, a difference of 0.32%).
| Demographics | Rating | Rank | Unemployment Among Ages 65 to 74 years |
| Cajuns | 1.8 /100 | #238 | Tragic 5.5% |
| German Russians | 1.6 /100 | #239 | Tragic 5.5% |
| Ghanaians | 1.4 /100 | #240 | Tragic 5.6% |
| Cree | 1.4 /100 | #241 | Tragic 5.6% |
| Immigrants | Ghana | 1.4 /100 | #242 | Tragic 5.6% |
| Immigrants | Peru | 1.3 /100 | #243 | Tragic 5.6% |
| Immigrants | Micronesia | 0.9 /100 | #244 | Tragic 5.6% |
| Immigrants | Greece | 0.9 /100 | #245 | Tragic 5.6% |
| Paraguayans | 0.9 /100 | #246 | Tragic 5.6% |
| Immigrants | Immigrants | 0.9 /100 | #247 | Tragic 5.6% |
| Immigrants | Argentina | 0.9 /100 | #248 | Tragic 5.6% |
| Trinidadians and Tobagonians | 0.8 /100 | #249 | Tragic 5.6% |
| Cape Verdeans | 0.7 /100 | #250 | Tragic 5.6% |
| Brazilians | 0.5 /100 | #251 | Tragic 5.6% |
| Colombians | 0.5 /100 | #252 | Tragic 5.6% |
| Immigrants | Brazil | 0.5 /100 | #253 | Tragic 5.6% |
| Immigrants | Costa Rica | 0.5 /100 | #254 | Tragic 5.6% |
| Immigrants | Haiti | 0.4 /100 | #255 | Tragic 5.6% |
| Native Hawaiians | 0.4 /100 | #256 | Tragic 5.6% |
| Immigrants | Southern Europe | 0.3 /100 | #257 | Tragic 5.6% |
| Immigrants | Western Africa | 0.3 /100 | #258 | Tragic 5.6% |