Tsimshian vs Immigrants from Southern Europe Male Unemployment
COMPARE
Tsimshian
Immigrants from Southern Europe
Male Unemployment
Male Unemployment Comparison
Tsimshian
Immigrants from Southern Europe
8.5%
MALE UNEMPLOYMENT
0.0/ 100
METRIC RATING
334th/ 347
METRIC RANK
5.4%
MALE UNEMPLOYMENT
17.7/ 100
METRIC RATING
195th/ 347
METRIC RANK
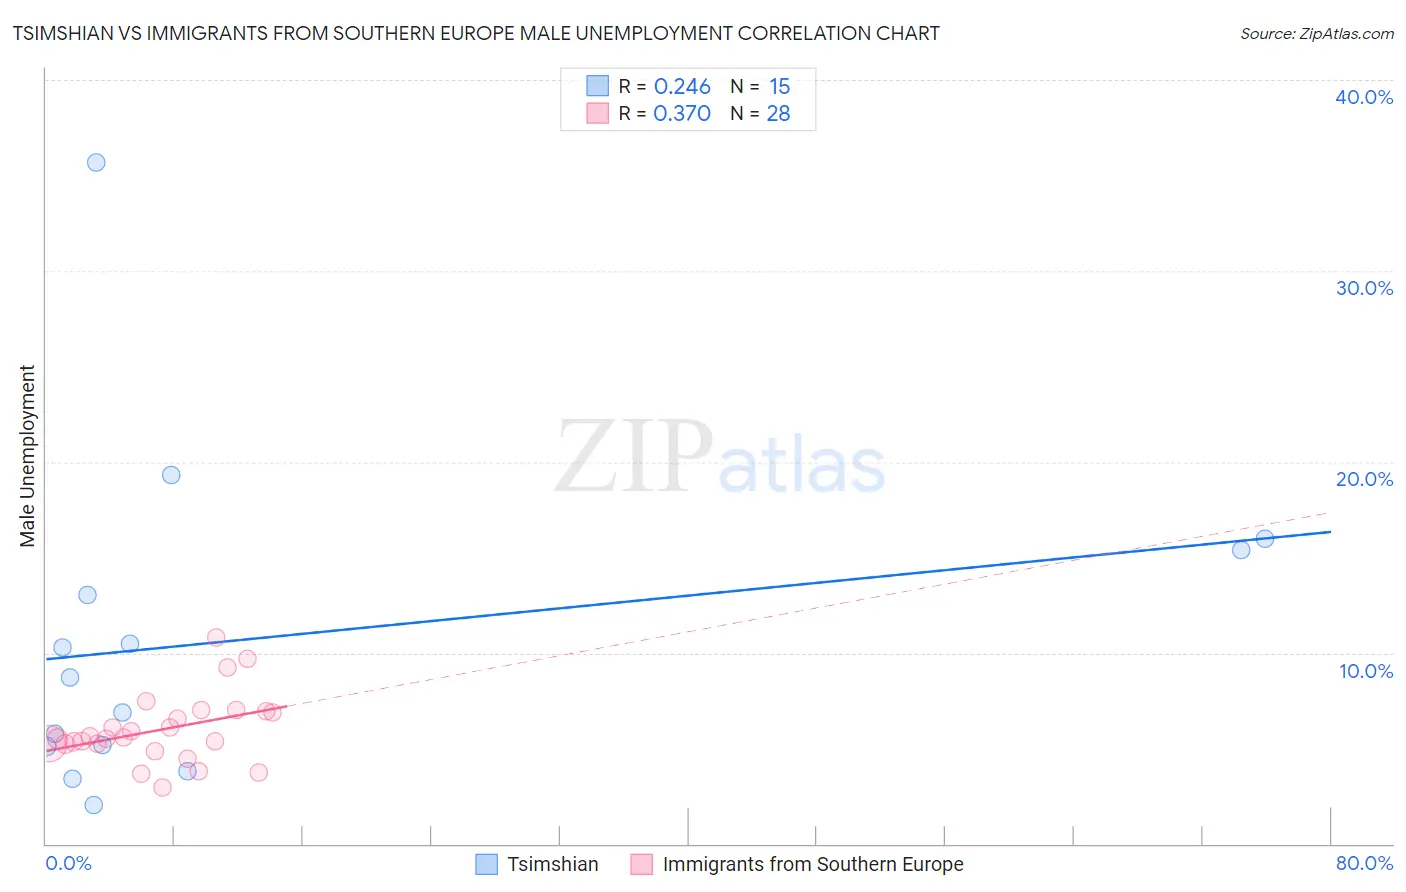
Tsimshian vs Immigrants from Southern Europe Male Unemployment Correlation Chart
The statistical analysis conducted on geographies consisting of 15,613,259 people shows a weak positive correlation between the proportion of Tsimshian and unemployment rate among males in the United States with a correlation coefficient (R) of 0.246 and weighted average of 8.5%. Similarly, the statistical analysis conducted on geographies consisting of 401,185,353 people shows a mild positive correlation between the proportion of Immigrants from Southern Europe and unemployment rate among males in the United States with a correlation coefficient (R) of 0.370 and weighted average of 5.4%, a difference of 56.3%.
Male Unemployment Correlation Summary
| Measurement | Tsimshian | Immigrants from Southern Europe |
| Minimum | 2.0% | 2.9% |
| Maximum | 35.7% | 10.8% |
| Range | 33.7% | 7.9% |
| Mean | 10.7% | 6.0% |
| Median | 8.7% | 5.5% |
| Interquartile 25% (IQ1) | 5.1% | 5.2% |
| Interquartile 75% (IQ3) | 15.4% | 6.9% |
| Interquartile Range (IQR) | 10.3% | 1.7% |
| Standard Deviation (Sample) | 8.6% | 1.8% |
| Standard Deviation (Population) | 8.3% | 1.7% |
Similar Demographics by Male Unemployment
Demographics Similar to Tsimshian by Male Unemployment
In terms of male unemployment, the demographic groups most similar to Tsimshian are Pueblo (8.5%, a difference of 0.060%), Sioux (8.4%, a difference of 0.97%), Yuman (8.6%, a difference of 1.4%), Puerto Rican (8.6%, a difference of 1.5%), and Apache (8.6%, a difference of 1.7%).
| Demographics | Rating | Rank | Male Unemployment |
| Paiute | 0.0 /100 | #327 | Tragic 7.7% |
| Natives/Alaskans | 0.0 /100 | #328 | Tragic 7.7% |
| Immigrants | Yemen | 0.0 /100 | #329 | Tragic 7.8% |
| Yakama | 0.0 /100 | #330 | Tragic 7.9% |
| Alaska Natives | 0.0 /100 | #331 | Tragic 8.1% |
| Pima | 0.0 /100 | #332 | Tragic 8.3% |
| Sioux | 0.0 /100 | #333 | Tragic 8.4% |
| Tsimshian | 0.0 /100 | #334 | Tragic 8.5% |
| Pueblo | 0.0 /100 | #335 | Tragic 8.5% |
| Yuman | 0.0 /100 | #336 | Tragic 8.6% |
| Puerto Ricans | 0.0 /100 | #337 | Tragic 8.6% |
| Apache | 0.0 /100 | #338 | Tragic 8.6% |
| Cheyenne | 0.0 /100 | #339 | Tragic 9.8% |
| Alaskan Athabascans | 0.0 /100 | #340 | Tragic 9.8% |
| Navajo | 0.0 /100 | #341 | Tragic 9.8% |
Demographics Similar to Immigrants from Southern Europe by Male Unemployment
In terms of male unemployment, the demographic groups most similar to Immigrants from Southern Europe are Albanian (5.4%, a difference of 0.040%), Alsatian (5.4%, a difference of 0.10%), Spanish (5.4%, a difference of 0.18%), Immigrants from Thailand (5.4%, a difference of 0.32%), and Immigrants from Greece (5.4%, a difference of 0.34%).
| Demographics | Rating | Rank | Male Unemployment |
| Arabs | 30.2 /100 | #188 | Fair 5.4% |
| Immigrants | South America | 29.4 /100 | #189 | Fair 5.4% |
| Immigrants | Uganda | 28.8 /100 | #190 | Fair 5.4% |
| Immigrants | South Eastern Asia | 28.2 /100 | #191 | Fair 5.4% |
| Immigrants | Belarus | 26.0 /100 | #192 | Fair 5.4% |
| Immigrants | Israel | 25.2 /100 | #193 | Fair 5.4% |
| Spanish | 19.7 /100 | #194 | Poor 5.4% |
| Immigrants | Southern Europe | 17.7 /100 | #195 | Poor 5.4% |
| Albanians | 17.3 /100 | #196 | Poor 5.4% |
| Alsatians | 16.7 /100 | #197 | Poor 5.4% |
| Immigrants | Thailand | 14.7 /100 | #198 | Poor 5.4% |
| Immigrants | Greece | 14.5 /100 | #199 | Poor 5.4% |
| Immigrants | Zaire | 13.7 /100 | #200 | Poor 5.4% |
| Immigrants | Philippines | 13.5 /100 | #201 | Poor 5.4% |
| Immigrants | Nonimmigrants | 13.1 /100 | #202 | Poor 5.4% |