German Russian vs Houma Unemployment Among Women with Children Under 6 years
COMPARE
German Russian
Houma
Unemployment Among Women with Children Under 6 years
Unemployment Among Women with Children Under 6 years Comparison
German Russians
Houma
8.2%
UNEMPLOYMENT AMONG WOMEN WITH CHILDREN UNDER 6 YEARS
1.2/ 100
METRIC RATING
247th/ 347
METRIC RANK
9.4%
UNEMPLOYMENT AMONG WOMEN WITH CHILDREN UNDER 6 YEARS
0.0/ 100
METRIC RATING
316th/ 347
METRIC RANK
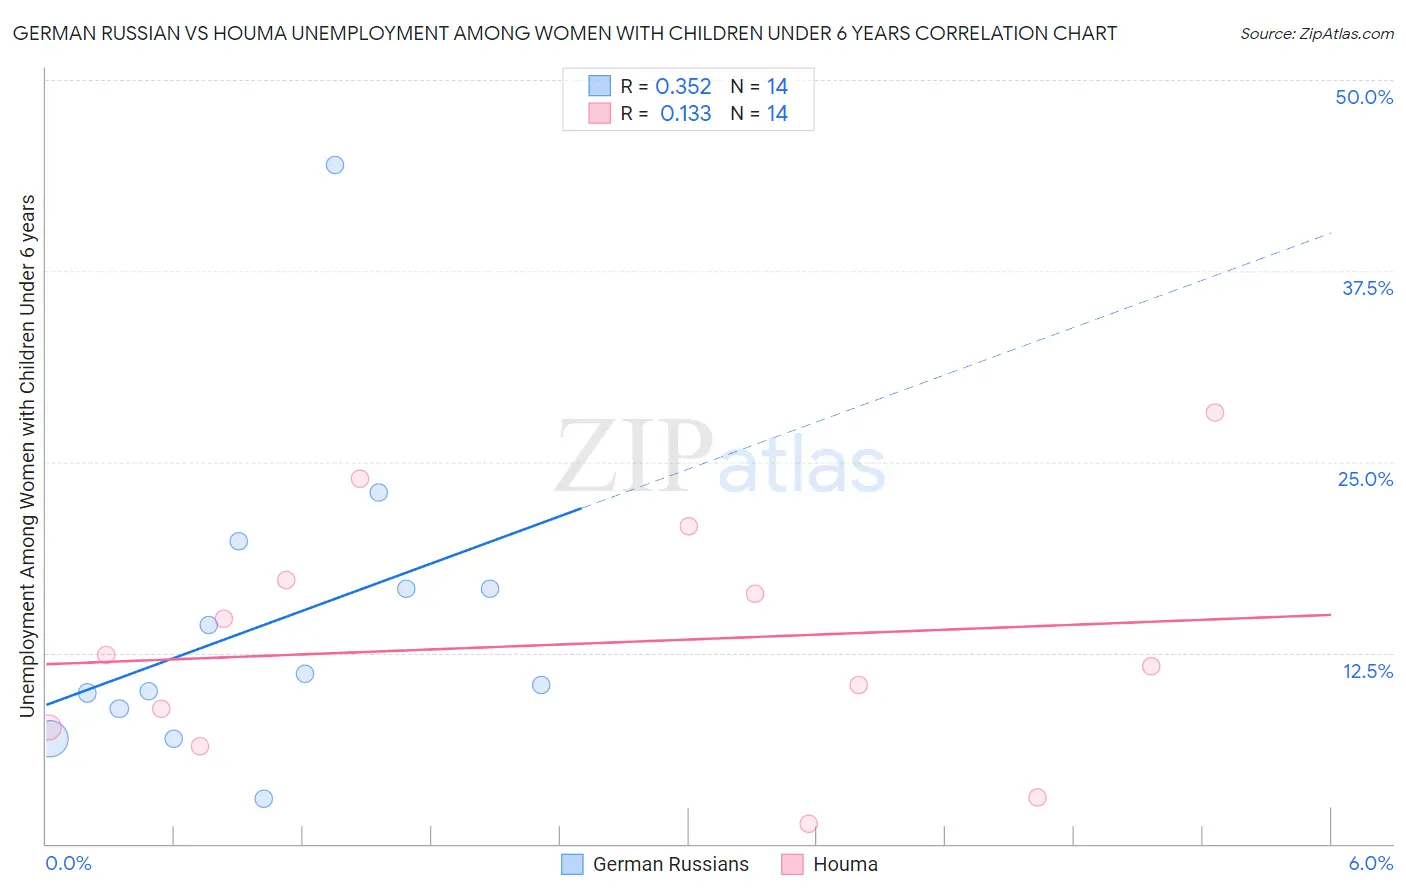
German Russian vs Houma Unemployment Among Women with Children Under 6 years Correlation Chart
The statistical analysis conducted on geographies consisting of 86,977,720 people shows a mild positive correlation between the proportion of German Russians and unemployment rate among women with children under the age of 6 in the United States with a correlation coefficient (R) of 0.352 and weighted average of 8.2%. Similarly, the statistical analysis conducted on geographies consisting of 34,510,951 people shows a poor positive correlation between the proportion of Houma and unemployment rate among women with children under the age of 6 in the United States with a correlation coefficient (R) of 0.133 and weighted average of 9.4%, a difference of 14.5%.
Unemployment Among Women with Children Under 6 years Correlation Summary
| Measurement | German Russian | Houma |
| Minimum | 2.9% | 1.3% |
| Maximum | 44.5% | 28.2% |
| Range | 41.5% | 26.9% |
| Mean | 14.4% | 13.1% |
| Median | 10.8% | 12.0% |
| Interquartile 25% (IQ1) | 8.9% | 7.6% |
| Interquartile 75% (IQ3) | 16.7% | 17.3% |
| Interquartile Range (IQR) | 7.8% | 9.7% |
| Standard Deviation (Sample) | 10.2% | 7.7% |
| Standard Deviation (Population) | 9.9% | 7.5% |
Similar Demographics by Unemployment Among Women with Children Under 6 years
Demographics Similar to German Russians by Unemployment Among Women with Children Under 6 years
In terms of unemployment among women with children under 6 years, the demographic groups most similar to German Russians are Immigrants from Western Africa (8.2%, a difference of 0.040%), Immigrants from Sierra Leone (8.2%, a difference of 0.13%), Nigerian (8.2%, a difference of 0.14%), Central American (8.2%, a difference of 0.28%), and Guyanese (8.2%, a difference of 0.31%).
| Demographics | Rating | Rank | Unemployment Among Women with Children Under 6 years |
| Immigrants | El Salvador | 2.6 /100 | #240 | Tragic 8.1% |
| Liberians | 2.6 /100 | #241 | Tragic 8.1% |
| Dutch | 2.5 /100 | #242 | Tragic 8.1% |
| Hawaiians | 1.8 /100 | #243 | Tragic 8.2% |
| French | 1.7 /100 | #244 | Tragic 8.2% |
| Native Hawaiians | 1.7 /100 | #245 | Tragic 8.2% |
| Central Americans | 1.4 /100 | #246 | Tragic 8.2% |
| German Russians | 1.2 /100 | #247 | Tragic 8.2% |
| Immigrants | Western Africa | 1.1 /100 | #248 | Tragic 8.2% |
| Immigrants | Sierra Leone | 1.1 /100 | #249 | Tragic 8.2% |
| Nigerians | 1.1 /100 | #250 | Tragic 8.2% |
| Guyanese | 1.0 /100 | #251 | Tragic 8.2% |
| Ghanaians | 1.0 /100 | #252 | Tragic 8.2% |
| Immigrants | Guyana | 0.8 /100 | #253 | Tragic 8.2% |
| Immigrants | Caribbean | 0.7 /100 | #254 | Tragic 8.3% |
Demographics Similar to Houma by Unemployment Among Women with Children Under 6 years
In terms of unemployment among women with children under 6 years, the demographic groups most similar to Houma are Cherokee (9.3%, a difference of 0.78%), Dutch West Indian (9.5%, a difference of 0.79%), Osage (9.5%, a difference of 0.85%), Fijian (9.3%, a difference of 1.6%), and American (9.3%, a difference of 1.6%).
| Demographics | Rating | Rank | Unemployment Among Women with Children Under 6 years |
| Africans | 0.0 /100 | #309 | Tragic 9.2% |
| Cajuns | 0.0 /100 | #310 | Tragic 9.2% |
| French American Indians | 0.0 /100 | #311 | Tragic 9.2% |
| Immigrants | Azores | 0.0 /100 | #312 | Tragic 9.2% |
| Americans | 0.0 /100 | #313 | Tragic 9.3% |
| Fijians | 0.0 /100 | #314 | Tragic 9.3% |
| Cherokee | 0.0 /100 | #315 | Tragic 9.3% |
| Houma | 0.0 /100 | #316 | Tragic 9.4% |
| Dutch West Indians | 0.0 /100 | #317 | Tragic 9.5% |
| Osage | 0.0 /100 | #318 | Tragic 9.5% |
| Marshallese | 0.0 /100 | #319 | Tragic 9.6% |
| Potawatomi | 0.0 /100 | #320 | Tragic 9.6% |
| Central American Indians | 0.0 /100 | #321 | Tragic 9.6% |
| Alaska Natives | 0.0 /100 | #322 | Tragic 9.6% |
| Immigrants | Bahamas | 0.0 /100 | #323 | Tragic 9.6% |