Immigrants from Western Europe vs Houma Unemployment Among Women with Children Under 6 years
COMPARE
Immigrants from Western Europe
Houma
Unemployment Among Women with Children Under 6 years
Unemployment Among Women with Children Under 6 years Comparison
Immigrants from Western Europe
Houma
7.7%
UNEMPLOYMENT AMONG WOMEN WITH CHILDREN UNDER 6 YEARS
44.9/ 100
METRIC RATING
179th/ 347
METRIC RANK
9.4%
UNEMPLOYMENT AMONG WOMEN WITH CHILDREN UNDER 6 YEARS
0.0/ 100
METRIC RATING
316th/ 347
METRIC RANK
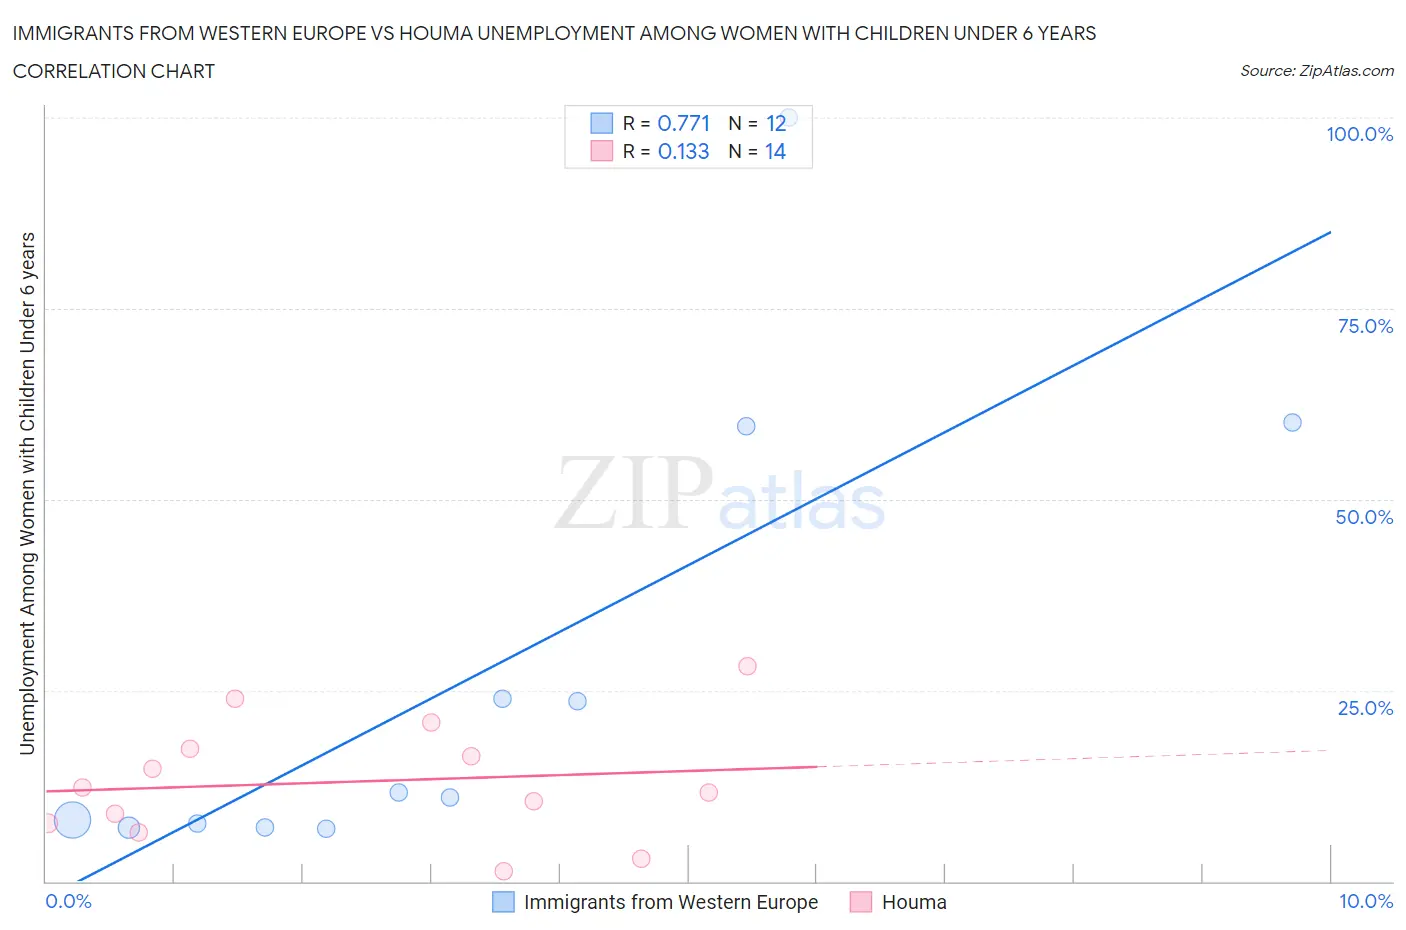
Immigrants from Western Europe vs Houma Unemployment Among Women with Children Under 6 years Correlation Chart
The statistical analysis conducted on geographies consisting of 350,429,370 people shows a strong positive correlation between the proportion of Immigrants from Western Europe and unemployment rate among women with children under the age of 6 in the United States with a correlation coefficient (R) of 0.771 and weighted average of 7.7%. Similarly, the statistical analysis conducted on geographies consisting of 34,510,951 people shows a poor positive correlation between the proportion of Houma and unemployment rate among women with children under the age of 6 in the United States with a correlation coefficient (R) of 0.133 and weighted average of 9.4%, a difference of 22.6%.
Unemployment Among Women with Children Under 6 years Correlation Summary
| Measurement | Immigrants from Western Europe | Houma |
| Minimum | 6.8% | 1.3% |
| Maximum | 100.0% | 28.2% |
| Range | 93.2% | 26.9% |
| Mean | 27.2% | 13.1% |
| Median | 11.3% | 12.0% |
| Interquartile 25% (IQ1) | 7.3% | 7.6% |
| Interquartile 75% (IQ3) | 41.8% | 17.3% |
| Interquartile Range (IQR) | 34.5% | 9.7% |
| Standard Deviation (Sample) | 30.1% | 7.7% |
| Standard Deviation (Population) | 28.8% | 7.5% |
Similar Demographics by Unemployment Among Women with Children Under 6 years
Demographics Similar to Immigrants from Western Europe by Unemployment Among Women with Children Under 6 years
In terms of unemployment among women with children under 6 years, the demographic groups most similar to Immigrants from Western Europe are Immigrants from England (7.7%, a difference of 0.030%), Immigrants from Uruguay (7.7%, a difference of 0.030%), Austrian (7.7%, a difference of 0.070%), Brazilian (7.7%, a difference of 0.070%), and Nepalese (7.7%, a difference of 0.090%).
| Demographics | Rating | Rank | Unemployment Among Women with Children Under 6 years |
| Immigrants | North America | 57.7 /100 | #172 | Average 7.6% |
| Cree | 51.6 /100 | #173 | Average 7.6% |
| Immigrants | Laos | 50.0 /100 | #174 | Average 7.6% |
| Panamanians | 49.6 /100 | #175 | Average 7.6% |
| Puget Sound Salish | 47.7 /100 | #176 | Average 7.7% |
| Austrians | 46.0 /100 | #177 | Average 7.7% |
| Immigrants | England | 45.4 /100 | #178 | Average 7.7% |
| Immigrants | Western Europe | 44.9 /100 | #179 | Average 7.7% |
| Immigrants | Uruguay | 44.5 /100 | #180 | Average 7.7% |
| Brazilians | 43.9 /100 | #181 | Average 7.7% |
| Nepalese | 43.5 /100 | #182 | Average 7.7% |
| Sierra Leoneans | 42.9 /100 | #183 | Average 7.7% |
| Indonesians | 40.5 /100 | #184 | Average 7.7% |
| Spanish Americans | 39.7 /100 | #185 | Fair 7.7% |
| Yugoslavians | 39.4 /100 | #186 | Fair 7.7% |
Demographics Similar to Houma by Unemployment Among Women with Children Under 6 years
In terms of unemployment among women with children under 6 years, the demographic groups most similar to Houma are Cherokee (9.3%, a difference of 0.78%), Dutch West Indian (9.5%, a difference of 0.79%), Osage (9.5%, a difference of 0.85%), Fijian (9.3%, a difference of 1.6%), and American (9.3%, a difference of 1.6%).
| Demographics | Rating | Rank | Unemployment Among Women with Children Under 6 years |
| Africans | 0.0 /100 | #309 | Tragic 9.2% |
| Cajuns | 0.0 /100 | #310 | Tragic 9.2% |
| French American Indians | 0.0 /100 | #311 | Tragic 9.2% |
| Immigrants | Azores | 0.0 /100 | #312 | Tragic 9.2% |
| Americans | 0.0 /100 | #313 | Tragic 9.3% |
| Fijians | 0.0 /100 | #314 | Tragic 9.3% |
| Cherokee | 0.0 /100 | #315 | Tragic 9.3% |
| Houma | 0.0 /100 | #316 | Tragic 9.4% |
| Dutch West Indians | 0.0 /100 | #317 | Tragic 9.5% |
| Osage | 0.0 /100 | #318 | Tragic 9.5% |
| Marshallese | 0.0 /100 | #319 | Tragic 9.6% |
| Potawatomi | 0.0 /100 | #320 | Tragic 9.6% |
| Central American Indians | 0.0 /100 | #321 | Tragic 9.6% |
| Alaska Natives | 0.0 /100 | #322 | Tragic 9.6% |
| Immigrants | Bahamas | 0.0 /100 | #323 | Tragic 9.6% |