Alsatian vs Houma Unemployment Among Women with Children Under 6 years
COMPARE
Alsatian
Houma
Unemployment Among Women with Children Under 6 years
Unemployment Among Women with Children Under 6 years Comparison
Alsatians
Houma
7.1%
UNEMPLOYMENT AMONG WOMEN WITH CHILDREN UNDER 6 YEARS
98.4/ 100
METRIC RATING
87th/ 347
METRIC RANK
9.4%
UNEMPLOYMENT AMONG WOMEN WITH CHILDREN UNDER 6 YEARS
0.0/ 100
METRIC RATING
316th/ 347
METRIC RANK
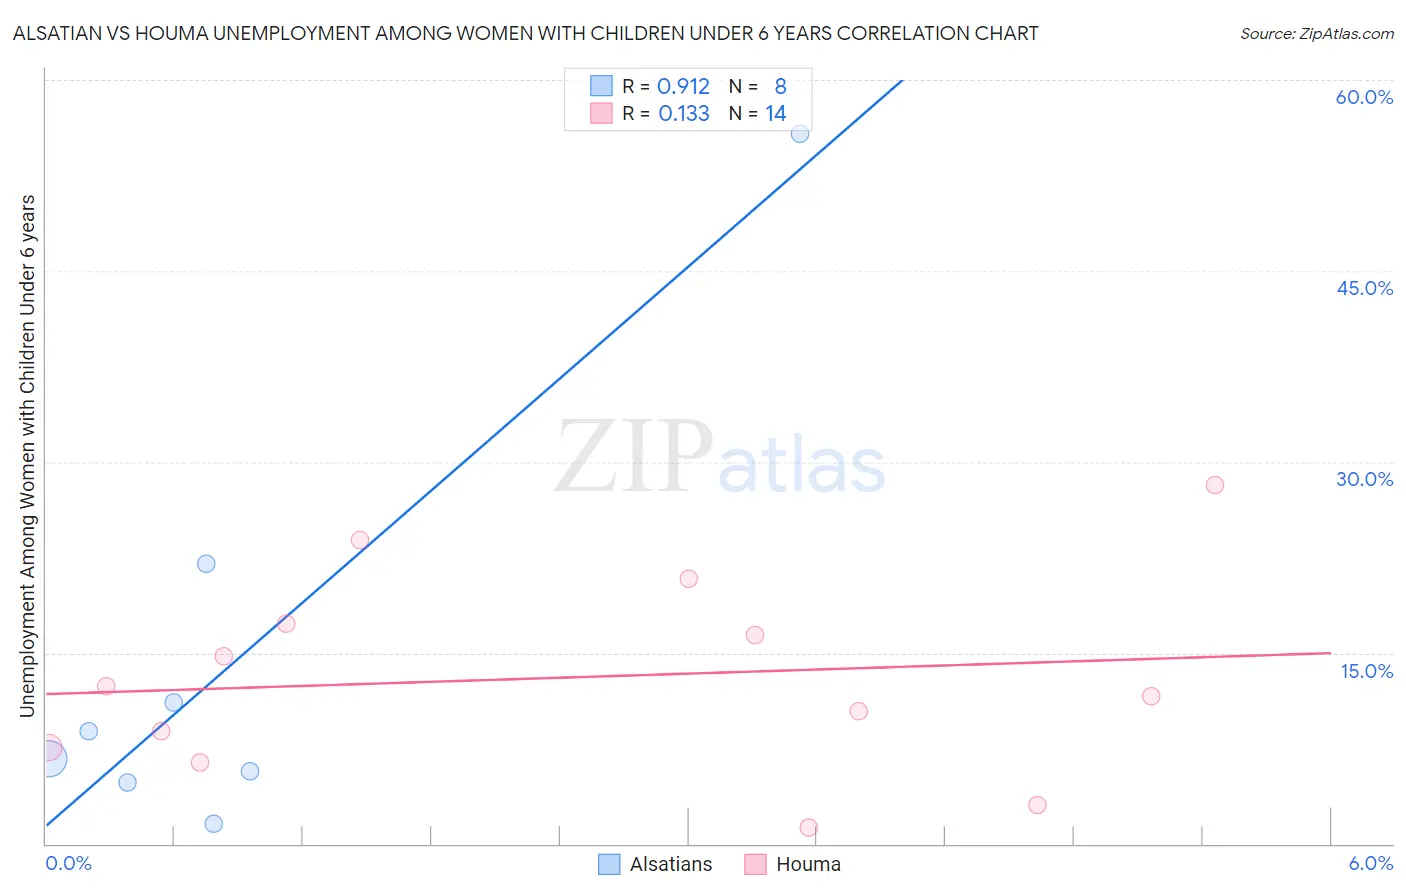
Alsatian vs Houma Unemployment Among Women with Children Under 6 years Correlation Chart
The statistical analysis conducted on geographies consisting of 73,942,058 people shows a near-perfect positive correlation between the proportion of Alsatians and unemployment rate among women with children under the age of 6 in the United States with a correlation coefficient (R) of 0.912 and weighted average of 7.1%. Similarly, the statistical analysis conducted on geographies consisting of 34,510,951 people shows a poor positive correlation between the proportion of Houma and unemployment rate among women with children under the age of 6 in the United States with a correlation coefficient (R) of 0.133 and weighted average of 9.4%, a difference of 32.0%.
Unemployment Among Women with Children Under 6 years Correlation Summary
| Measurement | Alsatian | Houma |
| Minimum | 1.6% | 1.3% |
| Maximum | 55.8% | 28.2% |
| Range | 54.2% | 26.9% |
| Mean | 14.6% | 13.1% |
| Median | 7.7% | 12.0% |
| Interquartile 25% (IQ1) | 5.3% | 7.6% |
| Interquartile 75% (IQ3) | 16.5% | 17.3% |
| Interquartile Range (IQR) | 11.3% | 9.7% |
| Standard Deviation (Sample) | 17.7% | 7.7% |
| Standard Deviation (Population) | 16.6% | 7.5% |
Similar Demographics by Unemployment Among Women with Children Under 6 years
Demographics Similar to Alsatians by Unemployment Among Women with Children Under 6 years
In terms of unemployment among women with children under 6 years, the demographic groups most similar to Alsatians are Immigrants from Hungary (7.1%, a difference of 0.12%), Immigrants from Zimbabwe (7.1%, a difference of 0.15%), Immigrants from Denmark (7.1%, a difference of 0.16%), Immigrants from Spain (7.1%, a difference of 0.22%), and Immigrants from Romania (7.1%, a difference of 0.28%).
| Demographics | Rating | Rank | Unemployment Among Women with Children Under 6 years |
| Immigrants | Greece | 98.9 /100 | #80 | Exceptional 7.1% |
| Immigrants | Venezuela | 98.8 /100 | #81 | Exceptional 7.1% |
| Immigrants | Afghanistan | 98.7 /100 | #82 | Exceptional 7.1% |
| Egyptians | 98.7 /100 | #83 | Exceptional 7.1% |
| Immigrants | Albania | 98.7 /100 | #84 | Exceptional 7.1% |
| Immigrants | Romania | 98.7 /100 | #85 | Exceptional 7.1% |
| Immigrants | Zimbabwe | 98.6 /100 | #86 | Exceptional 7.1% |
| Alsatians | 98.4 /100 | #87 | Exceptional 7.1% |
| Immigrants | Hungary | 98.3 /100 | #88 | Exceptional 7.1% |
| Immigrants | Denmark | 98.3 /100 | #89 | Exceptional 7.1% |
| Immigrants | Spain | 98.2 /100 | #90 | Exceptional 7.1% |
| Danes | 98.2 /100 | #91 | Exceptional 7.1% |
| Albanians | 98.0 /100 | #92 | Exceptional 7.2% |
| New Zealanders | 97.8 /100 | #93 | Exceptional 7.2% |
| Macedonians | 97.7 /100 | #94 | Exceptional 7.2% |
Demographics Similar to Houma by Unemployment Among Women with Children Under 6 years
In terms of unemployment among women with children under 6 years, the demographic groups most similar to Houma are Cherokee (9.3%, a difference of 0.78%), Dutch West Indian (9.5%, a difference of 0.79%), Osage (9.5%, a difference of 0.85%), Fijian (9.3%, a difference of 1.6%), and American (9.3%, a difference of 1.6%).
| Demographics | Rating | Rank | Unemployment Among Women with Children Under 6 years |
| Africans | 0.0 /100 | #309 | Tragic 9.2% |
| Cajuns | 0.0 /100 | #310 | Tragic 9.2% |
| French American Indians | 0.0 /100 | #311 | Tragic 9.2% |
| Immigrants | Azores | 0.0 /100 | #312 | Tragic 9.2% |
| Americans | 0.0 /100 | #313 | Tragic 9.3% |
| Fijians | 0.0 /100 | #314 | Tragic 9.3% |
| Cherokee | 0.0 /100 | #315 | Tragic 9.3% |
| Houma | 0.0 /100 | #316 | Tragic 9.4% |
| Dutch West Indians | 0.0 /100 | #317 | Tragic 9.5% |
| Osage | 0.0 /100 | #318 | Tragic 9.5% |
| Marshallese | 0.0 /100 | #319 | Tragic 9.6% |
| Potawatomi | 0.0 /100 | #320 | Tragic 9.6% |
| Central American Indians | 0.0 /100 | #321 | Tragic 9.6% |
| Alaska Natives | 0.0 /100 | #322 | Tragic 9.6% |
| Immigrants | Bahamas | 0.0 /100 | #323 | Tragic 9.6% |