German Russian vs Mexican Unemployment Among Women with Children Under 6 years
COMPARE
German Russian
Mexican
Unemployment Among Women with Children Under 6 years
Unemployment Among Women with Children Under 6 years Comparison
German Russians
Mexicans
8.2%
UNEMPLOYMENT AMONG WOMEN WITH CHILDREN UNDER 6 YEARS
1.2/ 100
METRIC RATING
247th/ 347
METRIC RANK
8.9%
UNEMPLOYMENT AMONG WOMEN WITH CHILDREN UNDER 6 YEARS
0.0/ 100
METRIC RATING
297th/ 347
METRIC RANK
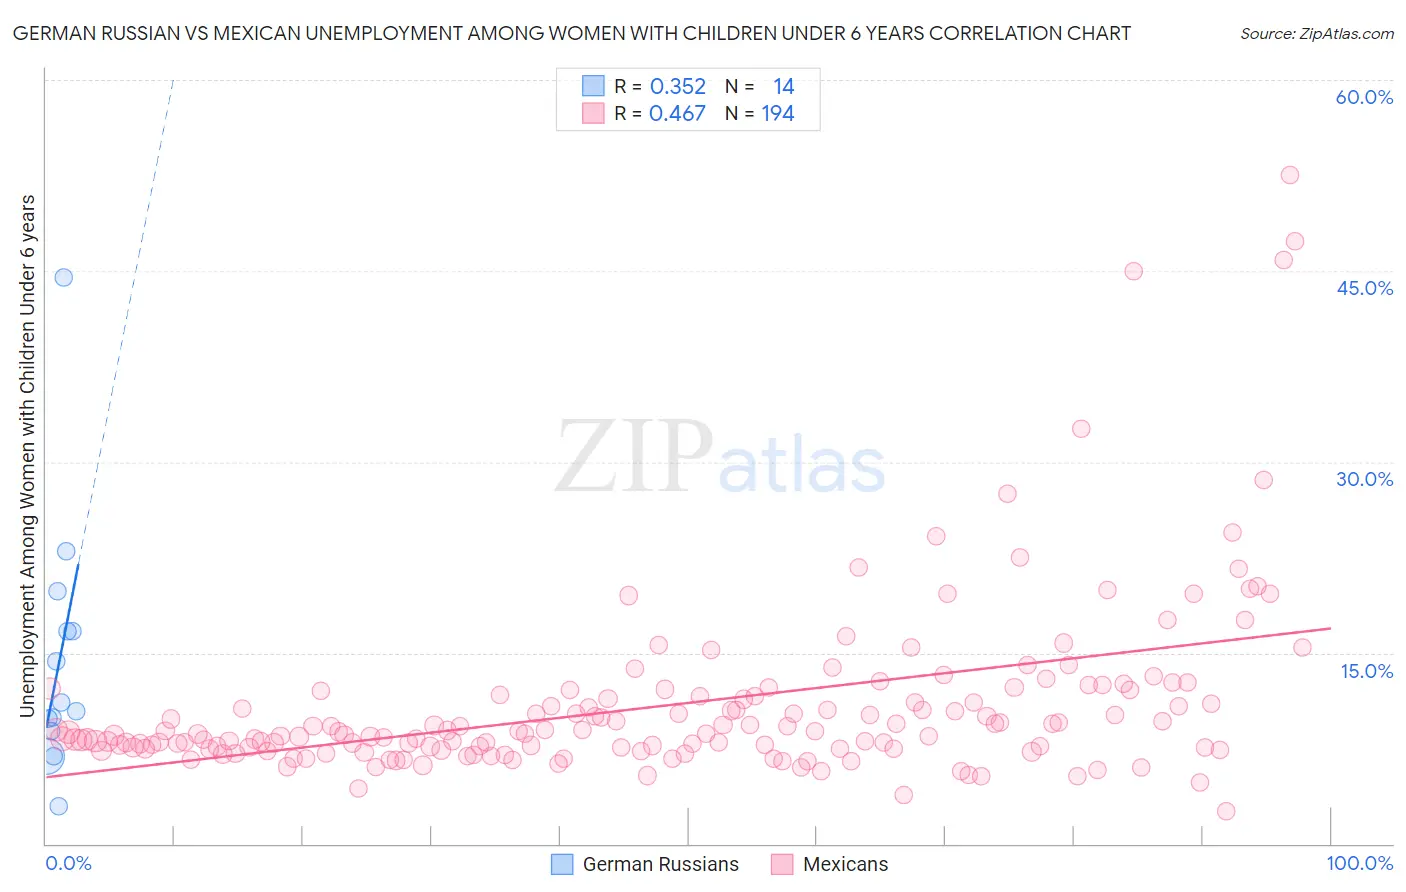
German Russian vs Mexican Unemployment Among Women with Children Under 6 years Correlation Chart
The statistical analysis conducted on geographies consisting of 86,977,720 people shows a mild positive correlation between the proportion of German Russians and unemployment rate among women with children under the age of 6 in the United States with a correlation coefficient (R) of 0.352 and weighted average of 8.2%. Similarly, the statistical analysis conducted on geographies consisting of 378,149,944 people shows a moderate positive correlation between the proportion of Mexicans and unemployment rate among women with children under the age of 6 in the United States with a correlation coefficient (R) of 0.467 and weighted average of 8.9%, a difference of 8.1%.
Unemployment Among Women with Children Under 6 years Correlation Summary
| Measurement | German Russian | Mexican |
| Minimum | 2.9% | 2.6% |
| Maximum | 44.5% | 52.5% |
| Range | 41.5% | 49.9% |
| Mean | 14.4% | 10.9% |
| Median | 10.8% | 8.7% |
| Interquartile 25% (IQ1) | 8.9% | 7.5% |
| Interquartile 75% (IQ3) | 16.7% | 11.6% |
| Interquartile Range (IQR) | 7.8% | 4.1% |
| Standard Deviation (Sample) | 10.2% | 7.1% |
| Standard Deviation (Population) | 9.9% | 7.0% |
Similar Demographics by Unemployment Among Women with Children Under 6 years
Demographics Similar to German Russians by Unemployment Among Women with Children Under 6 years
In terms of unemployment among women with children under 6 years, the demographic groups most similar to German Russians are Immigrants from Western Africa (8.2%, a difference of 0.040%), Immigrants from Sierra Leone (8.2%, a difference of 0.13%), Nigerian (8.2%, a difference of 0.14%), Central American (8.2%, a difference of 0.28%), and Guyanese (8.2%, a difference of 0.31%).
| Demographics | Rating | Rank | Unemployment Among Women with Children Under 6 years |
| Immigrants | El Salvador | 2.6 /100 | #240 | Tragic 8.1% |
| Liberians | 2.6 /100 | #241 | Tragic 8.1% |
| Dutch | 2.5 /100 | #242 | Tragic 8.1% |
| Hawaiians | 1.8 /100 | #243 | Tragic 8.2% |
| French | 1.7 /100 | #244 | Tragic 8.2% |
| Native Hawaiians | 1.7 /100 | #245 | Tragic 8.2% |
| Central Americans | 1.4 /100 | #246 | Tragic 8.2% |
| German Russians | 1.2 /100 | #247 | Tragic 8.2% |
| Immigrants | Western Africa | 1.1 /100 | #248 | Tragic 8.2% |
| Immigrants | Sierra Leone | 1.1 /100 | #249 | Tragic 8.2% |
| Nigerians | 1.1 /100 | #250 | Tragic 8.2% |
| Guyanese | 1.0 /100 | #251 | Tragic 8.2% |
| Ghanaians | 1.0 /100 | #252 | Tragic 8.2% |
| Immigrants | Guyana | 0.8 /100 | #253 | Tragic 8.2% |
| Immigrants | Caribbean | 0.7 /100 | #254 | Tragic 8.3% |
Demographics Similar to Mexicans by Unemployment Among Women with Children Under 6 years
In terms of unemployment among women with children under 6 years, the demographic groups most similar to Mexicans are Immigrants from Dominican Republic (8.9%, a difference of 0.10%), Tlingit-Haida (8.9%, a difference of 0.16%), Immigrants from Central America (8.9%, a difference of 0.23%), Nonimmigrants (8.8%, a difference of 0.27%), and Immigrants from Jamaica (8.9%, a difference of 0.37%).
| Demographics | Rating | Rank | Unemployment Among Women with Children Under 6 years |
| Vietnamese | 0.0 /100 | #290 | Tragic 8.8% |
| Jamaicans | 0.0 /100 | #291 | Tragic 8.8% |
| Cheyenne | 0.0 /100 | #292 | Tragic 8.8% |
| Immigrants | Bangladesh | 0.0 /100 | #293 | Tragic 8.8% |
| Immigrants | Nonimmigrants | 0.0 /100 | #294 | Tragic 8.8% |
| Immigrants | Central America | 0.0 /100 | #295 | Tragic 8.9% |
| Immigrants | Dominican Republic | 0.0 /100 | #296 | Tragic 8.9% |
| Mexicans | 0.0 /100 | #297 | Tragic 8.9% |
| Tlingit-Haida | 0.0 /100 | #298 | Tragic 8.9% |
| Immigrants | Jamaica | 0.0 /100 | #299 | Tragic 8.9% |
| Creek | 0.0 /100 | #300 | Tragic 8.9% |
| Chickasaw | 0.0 /100 | #301 | Tragic 9.0% |
| Hispanics or Latinos | 0.0 /100 | #302 | Tragic 9.0% |
| Immigrants | West Indies | 0.0 /100 | #303 | Tragic 9.0% |
| Immigrants | Mexico | 0.0 /100 | #304 | Tragic 9.1% |