French Canadian vs Costa Rican Unemployment Among Women with Children Under 6 years
COMPARE
French Canadian
Costa Rican
Unemployment Among Women with Children Under 6 years
Unemployment Among Women with Children Under 6 years Comparison
French Canadians
Costa Ricans
8.4%
UNEMPLOYMENT AMONG WOMEN WITH CHILDREN UNDER 6 YEARS
0.3/ 100
METRIC RATING
265th/ 347
METRIC RANK
7.8%
UNEMPLOYMENT AMONG WOMEN WITH CHILDREN UNDER 6 YEARS
17.6/ 100
METRIC RATING
209th/ 347
METRIC RANK
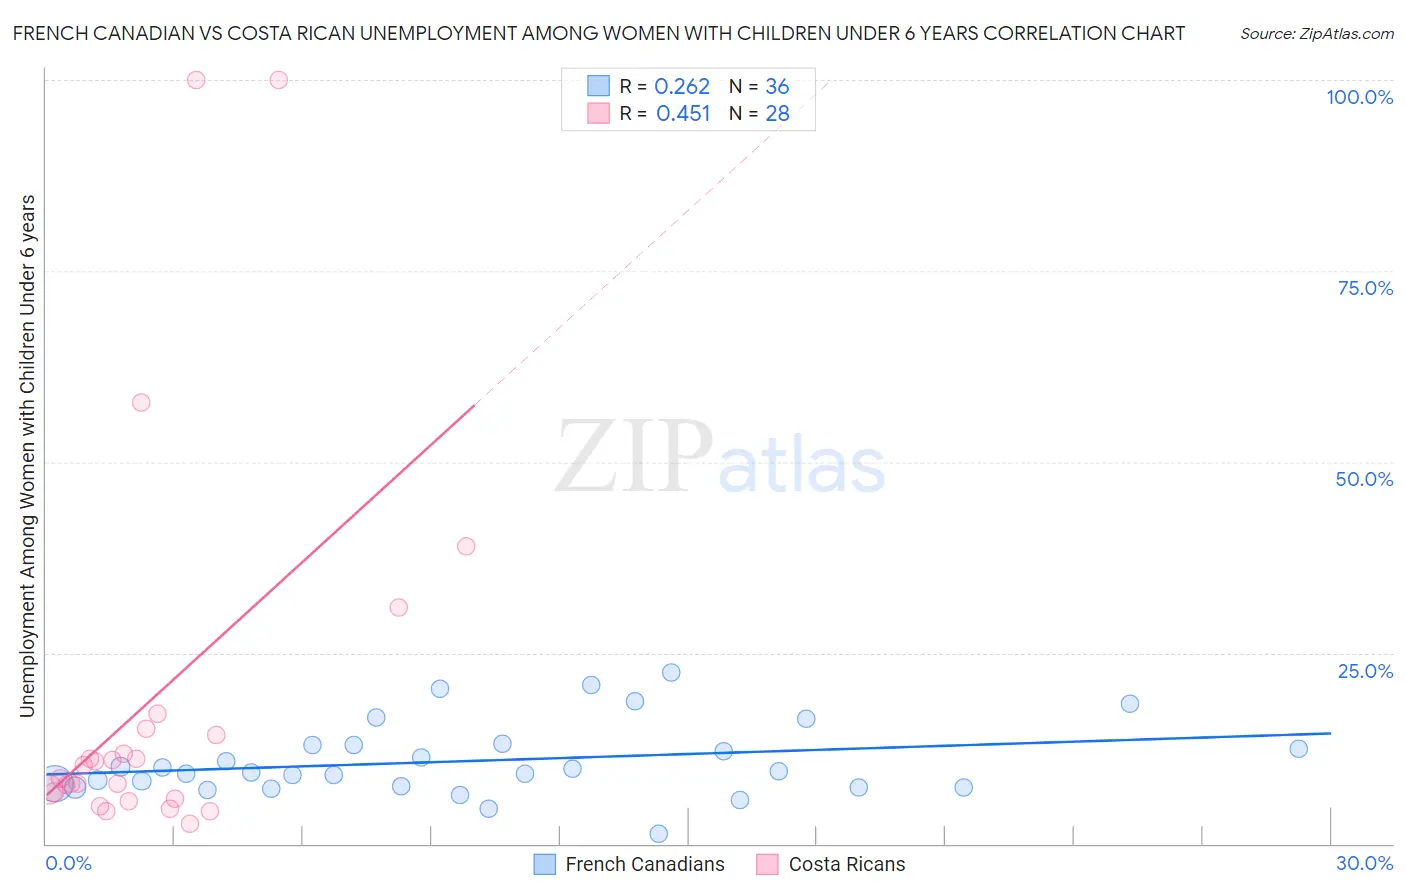
French Canadian vs Costa Rican Unemployment Among Women with Children Under 6 years Correlation Chart
The statistical analysis conducted on geographies consisting of 347,734,742 people shows a weak positive correlation between the proportion of French Canadians and unemployment rate among women with children under the age of 6 in the United States with a correlation coefficient (R) of 0.262 and weighted average of 8.4%. Similarly, the statistical analysis conducted on geographies consisting of 211,982,760 people shows a moderate positive correlation between the proportion of Costa Ricans and unemployment rate among women with children under the age of 6 in the United States with a correlation coefficient (R) of 0.451 and weighted average of 7.8%, a difference of 7.1%.
Unemployment Among Women with Children Under 6 years Correlation Summary
| Measurement | French Canadian | Costa Rican |
| Minimum | 1.4% | 2.6% |
| Maximum | 22.5% | 100.0% |
| Range | 21.1% | 97.4% |
| Mean | 10.9% | 18.8% |
| Median | 9.4% | 9.4% |
| Interquartile 25% (IQ1) | 7.4% | 6.3% |
| Interquartile 75% (IQ3) | 13.0% | 14.7% |
| Interquartile Range (IQR) | 5.5% | 8.4% |
| Standard Deviation (Sample) | 4.8% | 25.8% |
| Standard Deviation (Population) | 4.8% | 25.3% |
Similar Demographics by Unemployment Among Women with Children Under 6 years
Demographics Similar to French Canadians by Unemployment Among Women with Children Under 6 years
In terms of unemployment among women with children under 6 years, the demographic groups most similar to French Canadians are Immigrants from Honduras (8.4%, a difference of 0.0%), Honduran (8.4%, a difference of 0.050%), Scotch-Irish (8.4%, a difference of 0.070%), West Indian (8.4%, a difference of 0.10%), and Immigrants from Liberia (8.4%, a difference of 0.11%).
| Demographics | Rating | Rank | Unemployment Among Women with Children Under 6 years |
| Immigrants | Ghana | 0.5 /100 | #258 | Tragic 8.3% |
| Barbadians | 0.4 /100 | #259 | Tragic 8.3% |
| Whites/Caucasians | 0.3 /100 | #260 | Tragic 8.4% |
| Immigrants | Liberia | 0.3 /100 | #261 | Tragic 8.4% |
| West Indians | 0.3 /100 | #262 | Tragic 8.4% |
| Scotch-Irish | 0.3 /100 | #263 | Tragic 8.4% |
| Hondurans | 0.3 /100 | #264 | Tragic 8.4% |
| French Canadians | 0.3 /100 | #265 | Tragic 8.4% |
| Immigrants | Honduras | 0.3 /100 | #266 | Tragic 8.4% |
| Belizeans | 0.2 /100 | #267 | Tragic 8.4% |
| Sub-Saharan Africans | 0.2 /100 | #268 | Tragic 8.4% |
| Immigrants | Haiti | 0.2 /100 | #269 | Tragic 8.4% |
| Immigrants | Senegal | 0.2 /100 | #270 | Tragic 8.5% |
| Immigrants | Congo | 0.2 /100 | #271 | Tragic 8.5% |
| Mexican American Indians | 0.1 /100 | #272 | Tragic 8.5% |
Demographics Similar to Costa Ricans by Unemployment Among Women with Children Under 6 years
In terms of unemployment among women with children under 6 years, the demographic groups most similar to Costa Ricans are Immigrants from Syria (7.8%, a difference of 0.14%), Polish (7.9%, a difference of 0.18%), Immigrants from Ecuador (7.9%, a difference of 0.31%), Canadian (7.8%, a difference of 0.32%), and Hungarian (7.8%, a difference of 0.37%).
| Demographics | Rating | Rank | Unemployment Among Women with Children Under 6 years |
| Sudanese | 23.5 /100 | #202 | Fair 7.8% |
| Spaniards | 23.3 /100 | #203 | Fair 7.8% |
| Lebanese | 22.2 /100 | #204 | Fair 7.8% |
| Immigrants | Immigrants | 21.4 /100 | #205 | Fair 7.8% |
| Hungarians | 21.2 /100 | #206 | Fair 7.8% |
| Canadians | 20.6 /100 | #207 | Fair 7.8% |
| Immigrants | Syria | 18.9 /100 | #208 | Poor 7.8% |
| Costa Ricans | 17.6 /100 | #209 | Poor 7.8% |
| Poles | 16.0 /100 | #210 | Poor 7.9% |
| Immigrants | Ecuador | 14.9 /100 | #211 | Poor 7.9% |
| Swiss | 12.3 /100 | #212 | Poor 7.9% |
| Scottish | 11.4 /100 | #213 | Poor 7.9% |
| Spanish | 11.3 /100 | #214 | Poor 7.9% |
| Ecuadorians | 11.2 /100 | #215 | Poor 7.9% |
| Immigrants | Lebanon | 11.1 /100 | #216 | Poor 7.9% |