French Canadian vs Tongan Unemployment Among Women with Children Under 6 years
COMPARE
French Canadian
Tongan
Unemployment Among Women with Children Under 6 years
Unemployment Among Women with Children Under 6 years Comparison
French Canadians
Tongans
8.4%
UNEMPLOYMENT AMONG WOMEN WITH CHILDREN UNDER 6 YEARS
0.3/ 100
METRIC RATING
265th/ 347
METRIC RANK
6.9%
UNEMPLOYMENT AMONG WOMEN WITH CHILDREN UNDER 6 YEARS
99.7/ 100
METRIC RATING
64th/ 347
METRIC RANK
French Canadian vs Tongan Unemployment Among Women with Children Under 6 years Correlation Chart
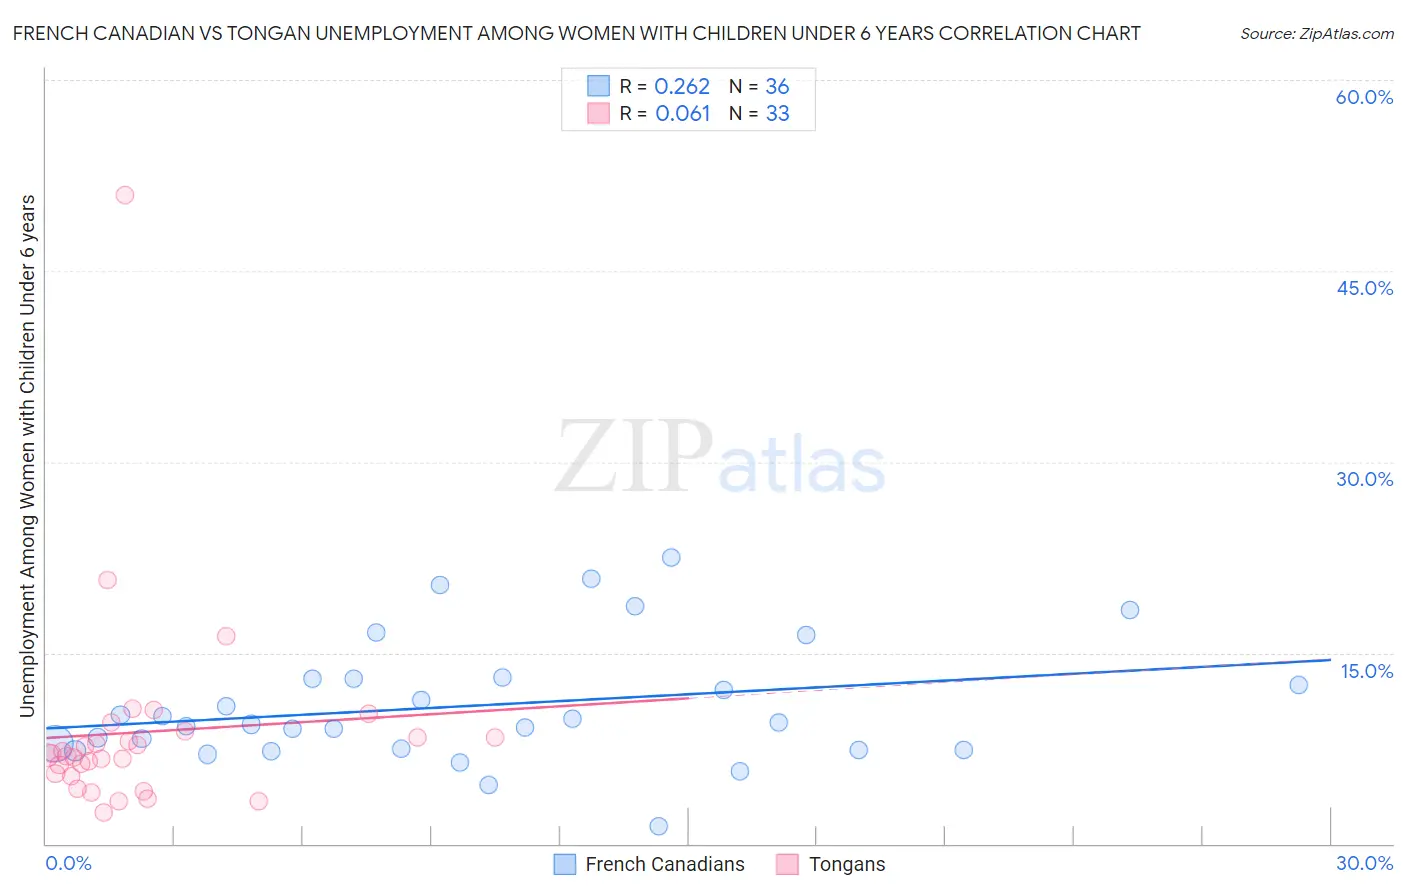
The statistical analysis conducted on geographies consisting of 347,734,742 people shows a weak positive correlation between the proportion of French Canadians and unemployment rate among women with children under the age of 6 in the United States with a correlation coefficient (R) of 0.262 and weighted average of 8.4%. Similarly, the statistical analysis conducted on geographies consisting of 92,875,365 people shows a slight positive correlation between the proportion of Tongans and unemployment rate among women with children under the age of 6 in the United States with a correlation coefficient (R) of 0.061 and weighted average of 6.9%, a difference of 21.4%.
Unemployment Among Women with Children Under 6 years Correlation Summary
| Measurement | French Canadian | Tongan |
| Minimum | 1.4% | 2.5% |
| Maximum | 22.5% | 51.0% |
| Range | 21.1% | 48.5% |
| Mean | 10.9% | 8.8% |
| Median | 9.4% | 6.9% |
| Interquartile 25% (IQ1) | 7.4% | 5.4% |
| Interquartile 75% (IQ3) | 13.0% | 8.6% |
| Interquartile Range (IQR) | 5.5% | 3.1% |
| Standard Deviation (Sample) | 4.8% | 8.4% |
| Standard Deviation (Population) | 4.8% | 8.3% |
Similar Demographics by Unemployment Among Women with Children Under 6 years
Demographics Similar to French Canadians by Unemployment Among Women with Children Under 6 years
In terms of unemployment among women with children under 6 years, the demographic groups most similar to French Canadians are Immigrants from Honduras (8.4%, a difference of 0.0%), Honduran (8.4%, a difference of 0.050%), Scotch-Irish (8.4%, a difference of 0.070%), West Indian (8.4%, a difference of 0.10%), and Immigrants from Liberia (8.4%, a difference of 0.11%).
| Demographics | Rating | Rank | Unemployment Among Women with Children Under 6 years |
| Immigrants | Ghana | 0.5 /100 | #258 | Tragic 8.3% |
| Barbadians | 0.4 /100 | #259 | Tragic 8.3% |
| Whites/Caucasians | 0.3 /100 | #260 | Tragic 8.4% |
| Immigrants | Liberia | 0.3 /100 | #261 | Tragic 8.4% |
| West Indians | 0.3 /100 | #262 | Tragic 8.4% |
| Scotch-Irish | 0.3 /100 | #263 | Tragic 8.4% |
| Hondurans | 0.3 /100 | #264 | Tragic 8.4% |
| French Canadians | 0.3 /100 | #265 | Tragic 8.4% |
| Immigrants | Honduras | 0.3 /100 | #266 | Tragic 8.4% |
| Belizeans | 0.2 /100 | #267 | Tragic 8.4% |
| Sub-Saharan Africans | 0.2 /100 | #268 | Tragic 8.4% |
| Immigrants | Haiti | 0.2 /100 | #269 | Tragic 8.4% |
| Immigrants | Senegal | 0.2 /100 | #270 | Tragic 8.5% |
| Immigrants | Congo | 0.2 /100 | #271 | Tragic 8.5% |
| Mexican American Indians | 0.1 /100 | #272 | Tragic 8.5% |
Demographics Similar to Tongans by Unemployment Among Women with Children Under 6 years
In terms of unemployment among women with children under 6 years, the demographic groups most similar to Tongans are Maltese (6.9%, a difference of 0.10%), Somali (6.9%, a difference of 0.15%), Immigrants from Kuwait (6.9%, a difference of 0.15%), Immigrants from France (6.9%, a difference of 0.19%), and Immigrants from Belgium (6.9%, a difference of 0.37%).
| Demographics | Rating | Rank | Unemployment Among Women with Children Under 6 years |
| Icelanders | 99.8 /100 | #57 | Exceptional 6.9% |
| Immigrants | Turkey | 99.8 /100 | #58 | Exceptional 6.9% |
| Immigrants | Serbia | 99.8 /100 | #59 | Exceptional 6.9% |
| Immigrants | Sri Lanka | 99.8 /100 | #60 | Exceptional 6.9% |
| Immigrants | France | 99.7 /100 | #61 | Exceptional 6.9% |
| Somalis | 99.7 /100 | #62 | Exceptional 6.9% |
| Maltese | 99.7 /100 | #63 | Exceptional 6.9% |
| Tongans | 99.7 /100 | #64 | Exceptional 6.9% |
| Immigrants | Kuwait | 99.7 /100 | #65 | Exceptional 6.9% |
| Immigrants | Belgium | 99.6 /100 | #66 | Exceptional 6.9% |
| Immigrants | Netherlands | 99.5 /100 | #67 | Exceptional 7.0% |
| Paraguayans | 99.4 /100 | #68 | Exceptional 7.0% |
| Immigrants | Eritrea | 99.4 /100 | #69 | Exceptional 7.0% |
| Immigrants | Iraq | 99.4 /100 | #70 | Exceptional 7.0% |
| Afghans | 99.4 /100 | #71 | Exceptional 7.0% |