French American Indian vs Immigrants from Congo Unemployment Among Women with Children Ages 6 to 17 years
COMPARE
French American Indian
Immigrants from Congo
Unemployment Among Women with Children Ages 6 to 17 years
Unemployment Among Women with Children Ages 6 to 17 years Comparison
French American Indians
Immigrants from Congo
9.3%
UNEMPLOYMENT AMONG WOMEN WITH CHILDREN AGES 6 TO 17 YEARS
3.7/ 100
METRIC RATING
232nd/ 347
METRIC RANK
9.0%
UNEMPLOYMENT AMONG WOMEN WITH CHILDREN AGES 6 TO 17 YEARS
32.5/ 100
METRIC RATING
185th/ 347
METRIC RANK
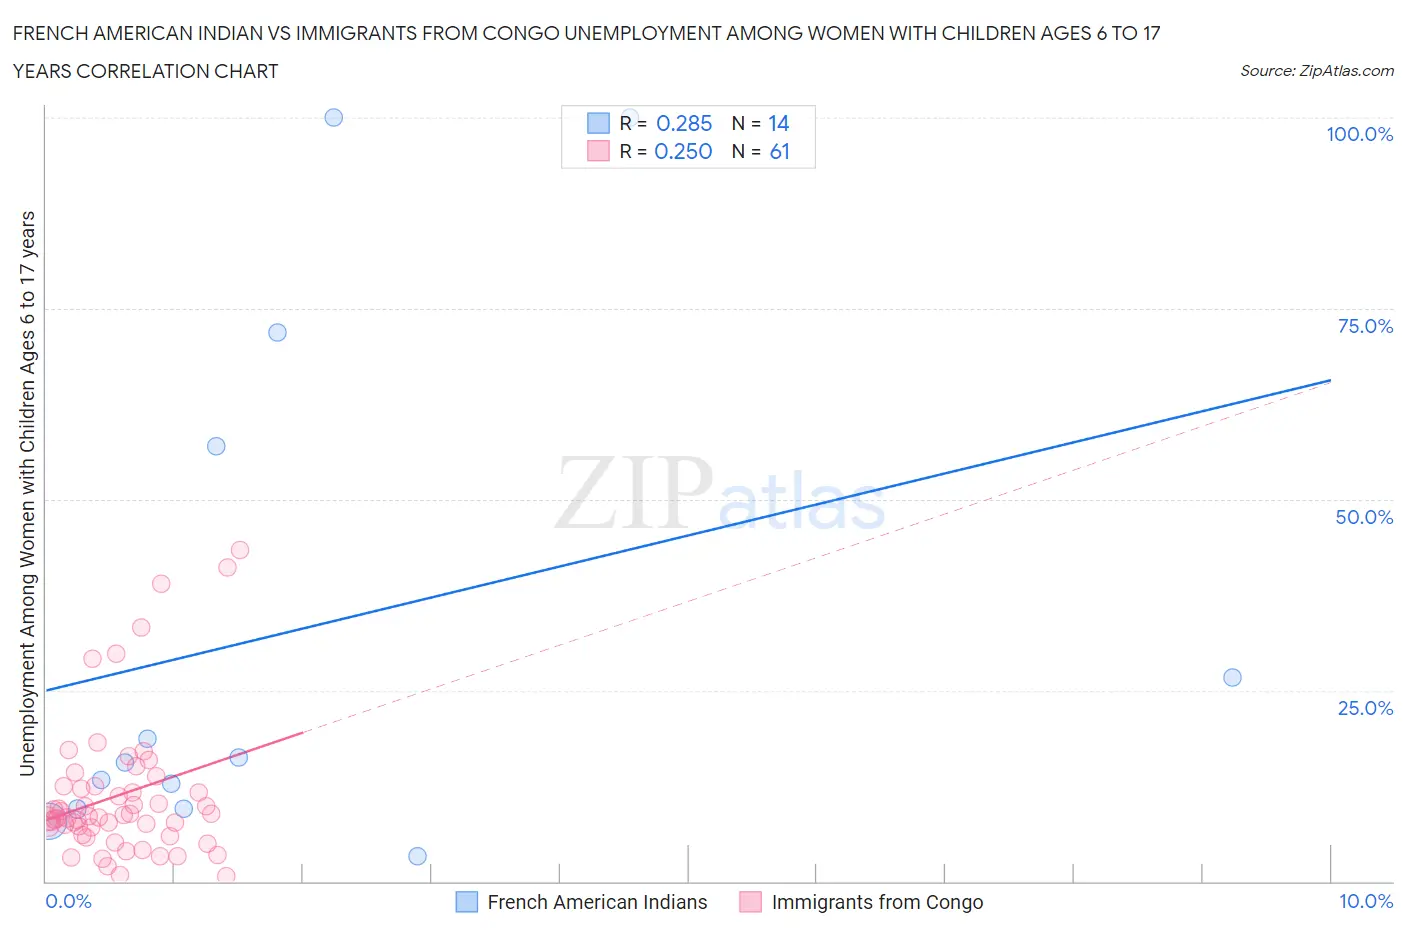
French American Indian vs Immigrants from Congo Unemployment Among Women with Children Ages 6 to 17 years Correlation Chart
The statistical analysis conducted on geographies consisting of 110,313,886 people shows a weak positive correlation between the proportion of French American Indians and unemployment rate among women with children between the ages 6 and 17 in the United States with a correlation coefficient (R) of 0.285 and weighted average of 9.3%. Similarly, the statistical analysis conducted on geographies consisting of 83,229,109 people shows a weak positive correlation between the proportion of Immigrants from Congo and unemployment rate among women with children between the ages 6 and 17 in the United States with a correlation coefficient (R) of 0.250 and weighted average of 9.0%, a difference of 2.8%.
Unemployment Among Women with Children Ages 6 to 17 years Correlation Summary
| Measurement | French American Indian | Immigrants from Congo |
| Minimum | 3.2% | 0.70% |
| Maximum | 100.0% | 43.4% |
| Range | 96.8% | 42.7% |
| Mean | 33.0% | 11.3% |
| Median | 15.9% | 8.5% |
| Interquartile 25% (IQ1) | 9.6% | 6.5% |
| Interquartile 75% (IQ3) | 57.0% | 12.5% |
| Interquartile Range (IQR) | 47.5% | 5.9% |
| Standard Deviation (Sample) | 34.3% | 9.3% |
| Standard Deviation (Population) | 33.1% | 9.2% |
Similar Demographics by Unemployment Among Women with Children Ages 6 to 17 years
Demographics Similar to French American Indians by Unemployment Among Women with Children Ages 6 to 17 years
In terms of unemployment among women with children ages 6 to 17 years, the demographic groups most similar to French American Indians are Macedonian (9.3%, a difference of 0.060%), Welsh (9.3%, a difference of 0.070%), Immigrants from St. Vincent and the Grenadines (9.3%, a difference of 0.12%), Mexican (9.3%, a difference of 0.15%), and Lumbee (9.3%, a difference of 0.17%).
| Demographics | Rating | Rank | Unemployment Among Women with Children Ages 6 to 17 years |
| Chinese | 5.2 /100 | #225 | Tragic 9.3% |
| Immigrants | Azores | 4.6 /100 | #226 | Tragic 9.3% |
| Panamanians | 4.5 /100 | #227 | Tragic 9.3% |
| Estonians | 4.4 /100 | #228 | Tragic 9.3% |
| Lumbee | 4.3 /100 | #229 | Tragic 9.3% |
| Welsh | 4.0 /100 | #230 | Tragic 9.3% |
| Macedonians | 3.9 /100 | #231 | Tragic 9.3% |
| French American Indians | 3.7 /100 | #232 | Tragic 9.3% |
| Immigrants | St. Vincent and the Grenadines | 3.3 /100 | #233 | Tragic 9.3% |
| Mexicans | 3.2 /100 | #234 | Tragic 9.3% |
| Uruguayans | 3.0 /100 | #235 | Tragic 9.3% |
| Hungarians | 3.0 /100 | #236 | Tragic 9.3% |
| Immigrants | Belize | 2.8 /100 | #237 | Tragic 9.3% |
| Arabs | 2.7 /100 | #238 | Tragic 9.3% |
| Immigrants | Saudi Arabia | 2.7 /100 | #239 | Tragic 9.3% |
Demographics Similar to Immigrants from Congo by Unemployment Among Women with Children Ages 6 to 17 years
In terms of unemployment among women with children ages 6 to 17 years, the demographic groups most similar to Immigrants from Congo are Immigrants from Spain (9.0%, a difference of 0.010%), Palestinian (9.0%, a difference of 0.040%), Swiss (9.0%, a difference of 0.050%), South American Indian (9.0%, a difference of 0.090%), and Immigrants from Czechoslovakia (9.0%, a difference of 0.10%).
| Demographics | Rating | Rank | Unemployment Among Women with Children Ages 6 to 17 years |
| Menominee | 39.3 /100 | #178 | Fair 9.0% |
| Immigrants | Zaire | 38.3 /100 | #179 | Fair 9.0% |
| Ethiopians | 37.6 /100 | #180 | Fair 9.0% |
| Immigrants | Czechoslovakia | 34.5 /100 | #181 | Fair 9.0% |
| South American Indians | 34.4 /100 | #182 | Fair 9.0% |
| Swiss | 33.5 /100 | #183 | Fair 9.0% |
| Palestinians | 33.4 /100 | #184 | Fair 9.0% |
| Immigrants | Congo | 32.5 /100 | #185 | Fair 9.0% |
| Immigrants | Spain | 32.4 /100 | #186 | Fair 9.0% |
| Comanche | 30.0 /100 | #187 | Fair 9.0% |
| Immigrants | Syria | 29.7 /100 | #188 | Fair 9.1% |
| Immigrants | Immigrants | 29.2 /100 | #189 | Fair 9.1% |
| Slovenes | 28.5 /100 | #190 | Fair 9.1% |
| Belizeans | 28.4 /100 | #191 | Fair 9.1% |
| Guamanians/Chamorros | 27.2 /100 | #192 | Fair 9.1% |