French American Indian vs Immigrants from Western Asia Unemployment Among Women with Children Ages 6 to 17 years
COMPARE
French American Indian
Immigrants from Western Asia
Unemployment Among Women with Children Ages 6 to 17 years
Unemployment Among Women with Children Ages 6 to 17 years Comparison
French American Indians
Immigrants from Western Asia
9.3%
UNEMPLOYMENT AMONG WOMEN WITH CHILDREN AGES 6 TO 17 YEARS
3.7/ 100
METRIC RATING
232nd/ 347
METRIC RANK
8.7%
UNEMPLOYMENT AMONG WOMEN WITH CHILDREN AGES 6 TO 17 YEARS
93.1/ 100
METRIC RATING
130th/ 347
METRIC RANK
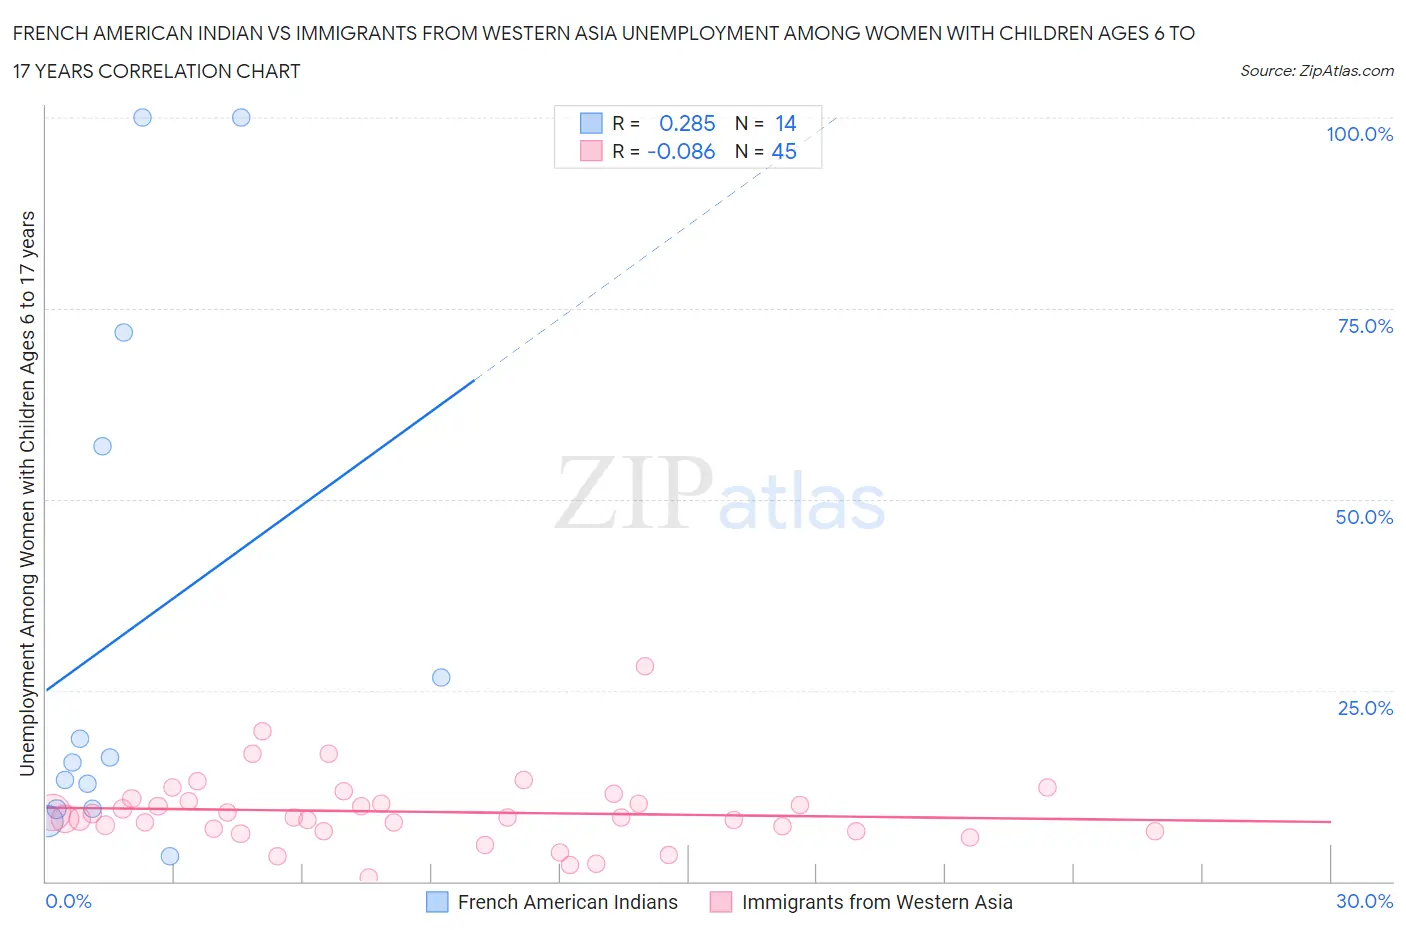
French American Indian vs Immigrants from Western Asia Unemployment Among Women with Children Ages 6 to 17 years Correlation Chart
The statistical analysis conducted on geographies consisting of 110,313,886 people shows a weak positive correlation between the proportion of French American Indians and unemployment rate among women with children between the ages 6 and 17 in the United States with a correlation coefficient (R) of 0.285 and weighted average of 9.3%. Similarly, the statistical analysis conducted on geographies consisting of 289,779,940 people shows a slight negative correlation between the proportion of Immigrants from Western Asia and unemployment rate among women with children between the ages 6 and 17 in the United States with a correlation coefficient (R) of -0.086 and weighted average of 8.7%, a difference of 6.7%.
Unemployment Among Women with Children Ages 6 to 17 years Correlation Summary
| Measurement | French American Indian | Immigrants from Western Asia |
| Minimum | 3.2% | 0.50% |
| Maximum | 100.0% | 28.1% |
| Range | 96.8% | 27.6% |
| Mean | 33.0% | 9.1% |
| Median | 15.9% | 8.4% |
| Interquartile 25% (IQ1) | 9.6% | 6.6% |
| Interquartile 75% (IQ3) | 57.0% | 10.7% |
| Interquartile Range (IQR) | 47.5% | 4.1% |
| Standard Deviation (Sample) | 34.3% | 4.8% |
| Standard Deviation (Population) | 33.1% | 4.7% |
Similar Demographics by Unemployment Among Women with Children Ages 6 to 17 years
Demographics Similar to French American Indians by Unemployment Among Women with Children Ages 6 to 17 years
In terms of unemployment among women with children ages 6 to 17 years, the demographic groups most similar to French American Indians are Macedonian (9.3%, a difference of 0.060%), Welsh (9.3%, a difference of 0.070%), Immigrants from St. Vincent and the Grenadines (9.3%, a difference of 0.12%), Mexican (9.3%, a difference of 0.15%), and Lumbee (9.3%, a difference of 0.17%).
| Demographics | Rating | Rank | Unemployment Among Women with Children Ages 6 to 17 years |
| Chinese | 5.2 /100 | #225 | Tragic 9.3% |
| Immigrants | Azores | 4.6 /100 | #226 | Tragic 9.3% |
| Panamanians | 4.5 /100 | #227 | Tragic 9.3% |
| Estonians | 4.4 /100 | #228 | Tragic 9.3% |
| Lumbee | 4.3 /100 | #229 | Tragic 9.3% |
| Welsh | 4.0 /100 | #230 | Tragic 9.3% |
| Macedonians | 3.9 /100 | #231 | Tragic 9.3% |
| French American Indians | 3.7 /100 | #232 | Tragic 9.3% |
| Immigrants | St. Vincent and the Grenadines | 3.3 /100 | #233 | Tragic 9.3% |
| Mexicans | 3.2 /100 | #234 | Tragic 9.3% |
| Uruguayans | 3.0 /100 | #235 | Tragic 9.3% |
| Hungarians | 3.0 /100 | #236 | Tragic 9.3% |
| Immigrants | Belize | 2.8 /100 | #237 | Tragic 9.3% |
| Arabs | 2.7 /100 | #238 | Tragic 9.3% |
| Immigrants | Saudi Arabia | 2.7 /100 | #239 | Tragic 9.3% |
Demographics Similar to Immigrants from Western Asia by Unemployment Among Women with Children Ages 6 to 17 years
In terms of unemployment among women with children ages 6 to 17 years, the demographic groups most similar to Immigrants from Western Asia are Barbadian (8.7%, a difference of 0.14%), Slavic (8.7%, a difference of 0.15%), Yaqui (8.7%, a difference of 0.16%), Egyptian (8.7%, a difference of 0.22%), and Hmong (8.7%, a difference of 0.24%).
| Demographics | Rating | Rank | Unemployment Among Women with Children Ages 6 to 17 years |
| Immigrants | Morocco | 94.9 /100 | #123 | Exceptional 8.7% |
| Immigrants | Lebanon | 94.9 /100 | #124 | Exceptional 8.7% |
| South Africans | 94.6 /100 | #125 | Exceptional 8.7% |
| Immigrants | Northern Africa | 94.4 /100 | #126 | Exceptional 8.7% |
| Czechs | 94.4 /100 | #127 | Exceptional 8.7% |
| Hmong | 94.3 /100 | #128 | Exceptional 8.7% |
| Barbadians | 93.8 /100 | #129 | Exceptional 8.7% |
| Immigrants | Western Asia | 93.1 /100 | #130 | Exceptional 8.7% |
| Slavs | 92.2 /100 | #131 | Exceptional 8.7% |
| Yaqui | 92.2 /100 | #132 | Exceptional 8.7% |
| Egyptians | 91.8 /100 | #133 | Exceptional 8.7% |
| Immigrants | Ireland | 91.0 /100 | #134 | Exceptional 8.7% |
| Europeans | 90.6 /100 | #135 | Exceptional 8.7% |
| Immigrants | Latvia | 90.4 /100 | #136 | Exceptional 8.7% |
| Immigrants | Argentina | 90.0 /100 | #137 | Excellent 8.7% |