Immigrants from Poland vs Immigrants from Congo Unemployment Among Women with Children Ages 6 to 17 years
COMPARE
Immigrants from Poland
Immigrants from Congo
Unemployment Among Women with Children Ages 6 to 17 years
Unemployment Among Women with Children Ages 6 to 17 years Comparison
Immigrants from Poland
Immigrants from Congo
8.8%
UNEMPLOYMENT AMONG WOMEN WITH CHILDREN AGES 6 TO 17 YEARS
88.3/ 100
METRIC RATING
140th/ 347
METRIC RANK
9.0%
UNEMPLOYMENT AMONG WOMEN WITH CHILDREN AGES 6 TO 17 YEARS
32.5/ 100
METRIC RATING
185th/ 347
METRIC RANK
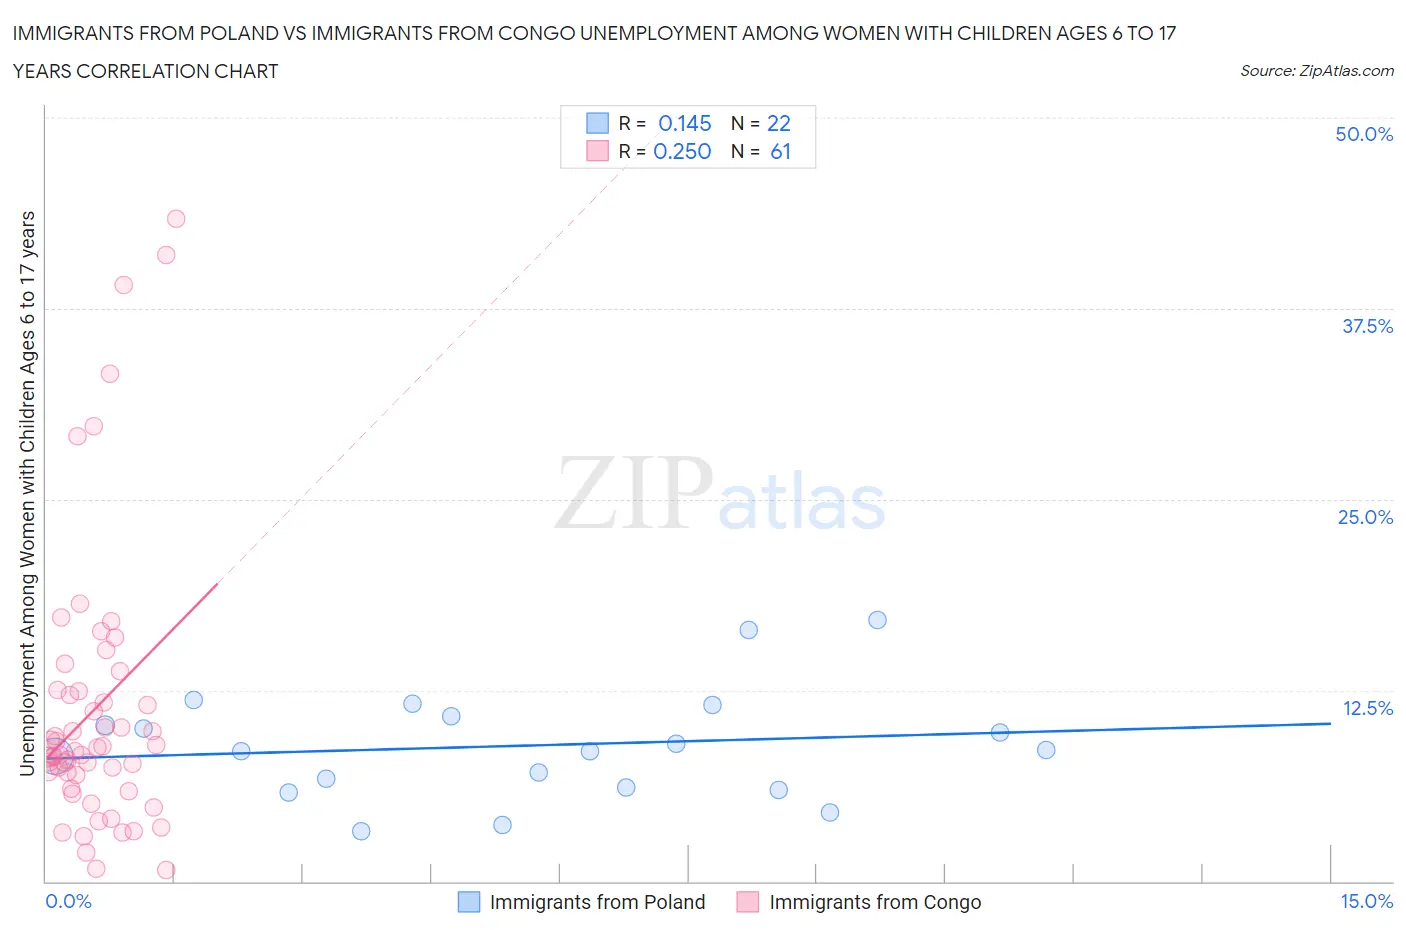
Immigrants from Poland vs Immigrants from Congo Unemployment Among Women with Children Ages 6 to 17 years Correlation Chart
The statistical analysis conducted on geographies consisting of 224,450,352 people shows a poor positive correlation between the proportion of Immigrants from Poland and unemployment rate among women with children between the ages 6 and 17 in the United States with a correlation coefficient (R) of 0.145 and weighted average of 8.8%. Similarly, the statistical analysis conducted on geographies consisting of 83,229,109 people shows a weak positive correlation between the proportion of Immigrants from Congo and unemployment rate among women with children between the ages 6 and 17 in the United States with a correlation coefficient (R) of 0.250 and weighted average of 9.0%, a difference of 3.1%.
Unemployment Among Women with Children Ages 6 to 17 years Correlation Summary
| Measurement | Immigrants from Poland | Immigrants from Congo |
| Minimum | 3.3% | 0.70% |
| Maximum | 17.1% | 43.4% |
| Range | 13.8% | 42.7% |
| Mean | 8.9% | 11.3% |
| Median | 8.5% | 8.5% |
| Interquartile 25% (IQ1) | 6.1% | 6.5% |
| Interquartile 75% (IQ3) | 10.8% | 12.5% |
| Interquartile Range (IQR) | 4.7% | 5.9% |
| Standard Deviation (Sample) | 3.6% | 9.3% |
| Standard Deviation (Population) | 3.5% | 9.2% |
Similar Demographics by Unemployment Among Women with Children Ages 6 to 17 years
Demographics Similar to Immigrants from Poland by Unemployment Among Women with Children Ages 6 to 17 years
In terms of unemployment among women with children ages 6 to 17 years, the demographic groups most similar to Immigrants from Poland are Serbian (8.8%, a difference of 0.070%), Immigrants from Austria (8.8%, a difference of 0.080%), Northern European (8.8%, a difference of 0.11%), Immigrants from Ethiopia (8.8%, a difference of 0.14%), and Immigrants from Argentina (8.7%, a difference of 0.20%).
| Demographics | Rating | Rank | Unemployment Among Women with Children Ages 6 to 17 years |
| Egyptians | 91.8 /100 | #133 | Exceptional 8.7% |
| Immigrants | Ireland | 91.0 /100 | #134 | Exceptional 8.7% |
| Europeans | 90.6 /100 | #135 | Exceptional 8.7% |
| Immigrants | Latvia | 90.4 /100 | #136 | Exceptional 8.7% |
| Immigrants | Argentina | 90.0 /100 | #137 | Excellent 8.7% |
| Immigrants | Ethiopia | 89.5 /100 | #138 | Excellent 8.8% |
| Northern Europeans | 89.2 /100 | #139 | Excellent 8.8% |
| Immigrants | Poland | 88.3 /100 | #140 | Excellent 8.8% |
| Serbians | 87.6 /100 | #141 | Excellent 8.8% |
| Immigrants | Austria | 87.5 /100 | #142 | Excellent 8.8% |
| Immigrants | Kenya | 86.1 /100 | #143 | Excellent 8.8% |
| Russians | 85.8 /100 | #144 | Excellent 8.8% |
| Kenyans | 85.6 /100 | #145 | Excellent 8.8% |
| Chileans | 80.8 /100 | #146 | Excellent 8.8% |
| Immigrants | Bangladesh | 79.4 /100 | #147 | Good 8.8% |
Demographics Similar to Immigrants from Congo by Unemployment Among Women with Children Ages 6 to 17 years
In terms of unemployment among women with children ages 6 to 17 years, the demographic groups most similar to Immigrants from Congo are Immigrants from Spain (9.0%, a difference of 0.010%), Palestinian (9.0%, a difference of 0.040%), Swiss (9.0%, a difference of 0.050%), South American Indian (9.0%, a difference of 0.090%), and Immigrants from Czechoslovakia (9.0%, a difference of 0.10%).
| Demographics | Rating | Rank | Unemployment Among Women with Children Ages 6 to 17 years |
| Menominee | 39.3 /100 | #178 | Fair 9.0% |
| Immigrants | Zaire | 38.3 /100 | #179 | Fair 9.0% |
| Ethiopians | 37.6 /100 | #180 | Fair 9.0% |
| Immigrants | Czechoslovakia | 34.5 /100 | #181 | Fair 9.0% |
| South American Indians | 34.4 /100 | #182 | Fair 9.0% |
| Swiss | 33.5 /100 | #183 | Fair 9.0% |
| Palestinians | 33.4 /100 | #184 | Fair 9.0% |
| Immigrants | Congo | 32.5 /100 | #185 | Fair 9.0% |
| Immigrants | Spain | 32.4 /100 | #186 | Fair 9.0% |
| Comanche | 30.0 /100 | #187 | Fair 9.0% |
| Immigrants | Syria | 29.7 /100 | #188 | Fair 9.1% |
| Immigrants | Immigrants | 29.2 /100 | #189 | Fair 9.1% |
| Slovenes | 28.5 /100 | #190 | Fair 9.1% |
| Belizeans | 28.4 /100 | #191 | Fair 9.1% |
| Guamanians/Chamorros | 27.2 /100 | #192 | Fair 9.1% |